All fact sheets · The Strata Memo
Zirconium
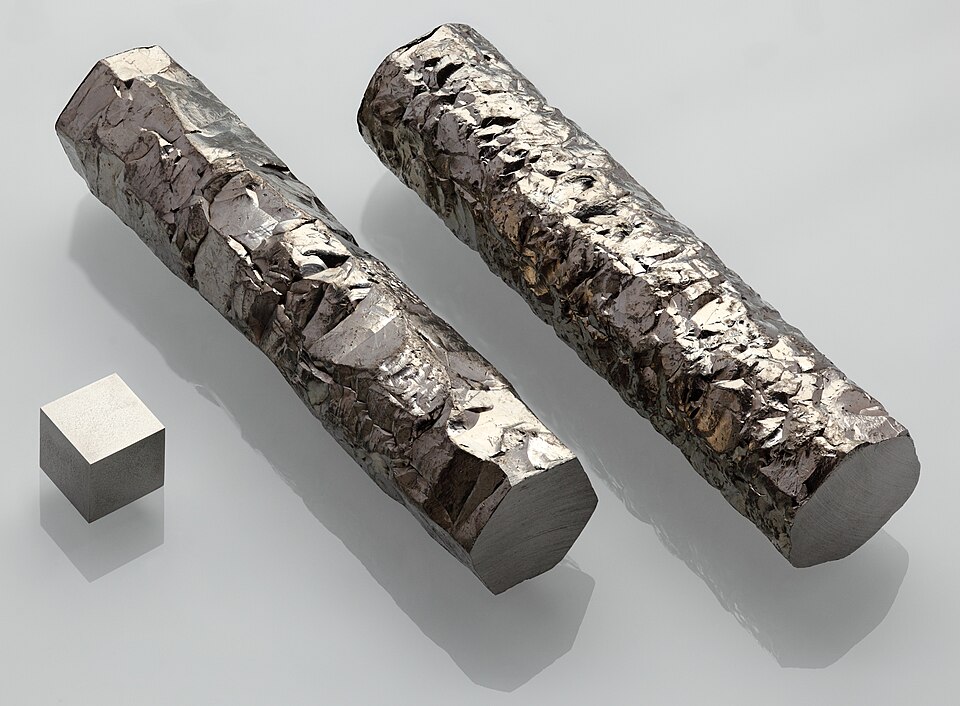

Hover, focus or tap to see the real thing
Photo Alchemist-hp ( pse-mendelejew.de ).. “Zirconium crystal bar and 1cm3 cube.jpg.” FAL. Wikimedia Commons. File page
Chemical details
- State at room conditions
- Solid
- Melting point
- 2,128 K (1,855 °C)
- Boiling point
- 4,682 K (4,409 °C)
- Density
- 6.52 g/cm³
- Common oxidation states
- +4
- Electronegativity (Pauling)
- 1.33
- Atomic radius
- 186 pm
- First ionization energy
- 6.634 eV
- Discovered
- 1789
Source: U.S. National Library of Medicine, PubChem, Periodic Table of Elements (element Zirconium) (current at retrieval)
On the USGS 2025 List of Critical Minerals. Figures: USGS Mineral Commodity Summaries 2026 (data release, public domain). Estimates are USGS's; check the USGS chapter for notes. Each panel names its source; full citations are in the methodology source register.
Overview
The headline numbers: how much the U.S. depends on imports and how concentrated supply is.
How much does the U.S. import?
of U.S. zirconium use was met by imports in 2025 (USGS net import reliance).
Source: U.S. Geological Survey, Mineral Commodity Summaries 2026: Zirconium (February 2026)
Did you know?
Zirconium takes its name from the mineral zircon, whose own name comes from the Persian word zargun, meaning "gold-like".
Two sources; the second is less authoritative or covers it loosely. Verified 2026-10-26.
Sources: Wikipedia · Los Alamos National Laboratory periodic table (Wikipedia text is CC BY-SA)
How concentrated is supply?
69% of world production comes from three countries (Australia, South Africa, Mozambique). Highly concentrated.
Thirds of the bar: under 33%, 33 to 65%, 66% and over. Our own rule of thumb, not a USGS rating.
Source: U.S. Geological Survey, Mineral Commodity Summaries 2026: Zirconium (February 2026)
Supply
Who produces it, where the reserves are, where U.S. imports come from, and how U.S. supply has moved.
Who has it, and who digs it?
Where it is produced, 2025 (Zirconium mineral concentrates, mine production (thousand metric tons, gross weight))
| Name | Value |
|---|---|
| Australia | 33% |
| South Africa | 22% |
| Mozambique | 13% |
| United States | 8% |
| China | 8% |
| Senegal | 6% |
Where the reserves are (Zirconium reserves(thousand metric tons, ZrO2 content))
| Name | Value |
|---|---|
| Australia | 71% |
| South Africa | 8% |
| Indonesia | 4% |
| Senegal | 3% |
| Madagascar | 3% |
| Mozambique | 2% |
Share of the world total as printed by USGS (rounded). Production and reserves are different things: reserves are what is economic to mine. Hover or focus a bar for its value, or switch to the table view.
Source: U.S. Geological Survey, Mineral Commodity Summaries 2026: Zirconium (February 2026)
Where U.S. imports come from
Choose a data set, then a view. A country keeps the same color in every chart on this page. Grey means other countries, or a country beyond the seven colors (always labeled). Hover or focus a mark for its value, or use the table view.
- South Africa48%
- Australia35%
- Senegal15%
- Other countries2%
| Country | Share of U.S. imports | Share of this chart |
|---|---|---|
| South Africa | 48% | 48.0% |
| Australia | 35% | 35.0% |
| Senegal | 15% | 15.0% |
| Other countries | 2% | 2.0% |
Average share of U.S. imports of zirconium ores and concentrates, 2021–24, as printed by USGS (rounded, so shares may not sum to 100). Other countries are USGS's own grouping.
Source: U.S. Geological Survey, Mineral Commodity Summaries 2026: Zirconium (February 2026)
- China41%
- South Africa31%
- France12%
- Australia10%
- Other countries6%
| Country | Share of U.S. imports | Share of this chart |
|---|---|---|
| China | 41% | 41.0% |
| South Africa | 31% | 31.0% |
| France | 12% | 12.0% |
| Australia | 10% | 10.0% |
| Other countries | 6% | 6.0% |
Average share of U.S. imports of zirconium, compounds, 2021–24, as printed by USGS (rounded, so shares may not sum to 100). Other countries are USGS's own grouping.
Source: U.S. Geological Survey, Mineral Commodity Summaries 2026: Zirconium (February 2026)
- China55%
- Germany15%
- Canada12%
- France7%
- Other countries11%
| Country | Share of U.S. imports | Share of this chart |
|---|---|---|
| China | 55% | 55.0% |
| Germany | 15% | 15.0% |
| Canada | 12% | 12.0% |
| France | 7% | 7.0% |
| Other countries | 11% | 11.0% |
Average share of U.S. imports of zirconium, unwrought, 2021–24, as printed by USGS (rounded, so shares may not sum to 100). Other countries are USGS's own grouping.
Source: U.S. Geological Survey, Mineral Commodity Summaries 2026: Zirconium (February 2026)
- France72%
- Germany10%
- Belgium7%
- China4%
- Other countries7%
| Country | Share of U.S. imports | Share of this chart |
|---|---|---|
| France | 72% | 72.0% |
| Germany | 10% | 10.0% |
| Belgium | 7% | 7.0% |
| China | 4% | 4.0% |
| Other countries | 7% | 7.0% |
Average share of U.S. imports of zirconium, wrought, 2021–24, as printed by USGS (rounded, so shares may not sum to 100). Other countries are USGS's own grouping.
Source: U.S. Geological Survey, Mineral Commodity Summaries 2026: Zirconium (February 2026)
- Australia49% · $15.7M
- South Africa34% · $10.7M
- Russia8% · $2.4M
- Senegal7% · $2.1M
- Malaysia1% · $363K
- China1% · $256K
- All other countries1% · $296K
| Country | U.S. imports, 2025 | Share of this chart |
|---|---|---|
| Australia | 49% · $15.7M | 49.3% |
| South Africa | 34% · $10.7M | 33.7% |
| Russia | 8% · $2.4M | 7.6% |
| Senegal | 7% · $2.1M | 6.6% |
| Malaysia | 1% · $363K | 1.1% |
| China | 1% · $256K | 0.8% |
| All other countries | 1% · $296K | 0.9% |
U.S. general imports (customs value) in calendar 2025 under HS 2615.10; countries beyond the top six are grouped. The code can include goods beyond this mineral. The Shift view compares each country's share of 2025 with its share of Jan to Aug 2026 (shares of each period's total).
Source: U.S. Census Bureau, International Trade API: U.S. imports by HS code and country (calendar 2025; Jan to Aug 2026) (data months 2025-12, 2026-08)
- France63% · $76.0M
- China26% · $31.9M
- Canada4% · $4.5M
- Germany3% · $3.9M
- Japan2% · $2.5M
- Sweden1% · $908K
- All other countries1% · $784K
| Country | U.S. imports, 2025 | Share of this chart |
|---|---|---|
| France | 63% · $76.0M | 63.1% |
| China | 26% · $31.9M | 26.5% |
| Canada | 4% · $4.5M | 3.7% |
| Germany | 3% · $3.9M | 3.2% |
| Japan | 2% · $2.5M | 2.1% |
| Sweden | 1% · $908K | 0.8% |
| All other countries | 1% · $784K | 0.7% |
U.S. general imports (customs value) in calendar 2025 under HS 8109; countries beyond the top six are grouped. The code can include goods beyond this mineral. The Shift view compares each country's share of 2025 with its share of Jan to Aug 2026 (shares of each period's total).
Source: U.S. Census Bureau, International Trade API: U.S. imports by HS code and country (calendar 2025; Jan to Aug 2026) (data months 2025-12, 2026-08)
Price
Price: Zirconium, sponge, ex-works China, dollars per kilogram
Source: U.S. Geological Survey, Mineral Commodity Summaries 2026: Zirconium (February 2026)
Trade and tariffs
Tariff codes and the countries behind U.S. imports and exports.
Trade codes and tariffs
| HTS code | What it covers | Normal rate | Column 2 rate |
|---|---|---|---|
| 2615.10 | Zirconium ores and concentrates | Free * | Free |
| 8109 | Zirconium and articles thereof, including waste and scrap | Free to 4.2% | Free to 45% |
Rates from the U.S. Harmonized Tariff Schedule (USITC, saved 2026-10-26). The normal rate is column 1 general; column 2 applies to countries without normal trade relations. A range means different products under the code have different rates. An asterisk means the schedule footnotes point to Chapter 99 additional-duty headings. Section 232, Section 301, emergency tariffs and antidumping or countervailing duties are set in separate notices and are not shown. Look up any code at hts.usitc.gov. These are the main codes for this mineral, not a complete list.
Source: U.S. International Trade Commission, Harmonized Tariff Schedule of the United States, general and column 2 rates (edition current when saved)
U.S. trade by country
U.S. imports in 2025 by source country, code 8109
| Name | Value |
|---|---|
| France | 63% · $76.0M |
| China | 26% · $31.9M |
| Canada | 4% · $4.5M |
| Germany | 3% · $3.9M |
| Japan | 2% · $2.5M |
| Sweden | 1% · $908K |
U.S. exports in 2025 by destination, code 8109
| Name | Value |
|---|---|
| Canada | 24% · $64.3M |
| Korea, South | 22% · $57.6M |
| France | 15% · $39.7M |
| Sweden | 8% · $21.9M |
| United Kingdom | 8% · $21.0M |
| Ukraine | 5% · $12.7M |
2615.10 Zirconium ores and concentrates
Top import sources Australia 49%, South Africa 34%, Russia 8%
Top export destinations India 29%, Mexico 20%, Brazil 9%
8109 Zirconium & articles thereof, includ waste & scrap
Top import sources France 63%, China 26%, Canada 4%
Top export destinations Canada 24%, Korea, South 22%, France 15%
U.S. Census Bureau International Trade API, saved 2026-10-26. Imports are general imports (customs value) and exports are total exports, in U.S. dollars. Duty collected is Census's calculated duty on imports for consumption. Figures cover every 10-digit product under the code, so they can include goods beyond this mineral, and the duty shown is not split into Section 232, Section 301 or antidumping duties. Bars show the largest code for each direction. Group rows such as the EU or OECD are left out so no country is counted twice.
Source: U.S. Census Bureau, International Trade API: U.S. imports and exports by HS code and country (calendar 2025, and January to Aug 2026) (data months 2025-12, 2026-08)
Value chain and risk
Where in the chain the bottlenecks sit, and what other governments and sources say about supply risk.
Value chain: where the bottlenecks are
Mining
One U.S. company recovers zircon as a coproduct of heavy-mineral-sands mining in Florida and Georgia, and a second processes mineral-sands tailings in California. (U.S. activity)
The source says
“one company recovered zircon (zirconium silicate) from surface-mining operations in Florida and Georgia as a coproduct from the mining of heavy-mineral sands, and a second company processed existing mineral sands tailings in California.”
Source: USGS Mineral Commodity Summaries 2026, Zirconium and Hafnium (PDF page 218) (2026-02)
Ore processing and primary recovery
U.S. zircon comes partly from domestic heavy-mineral sands (Florida, Georgia) and tailings (California) and partly from imports, mainly from South Africa (48%), Australia (35%) and Senegal (15%). (partly U.S.)
The source says
“In 2025, one company recovered zircon (zirconium silicate) from surface-mining operations in Florida and Georgia as a coproduct from the mining of heavy-mineral sands, and a second company processed existing mineral sands tailings in California.”
“Import sources (2021-24): Zirconium ores and concentrates: South Africa, 48%; Australia, 35%; Senegal, 15%; and other, 2%.”
Source: USGS Mineral Commodity Summaries 2026, Zirconium and Hafnium (PDF page 218) (2026-02)
Refining and separation
Zirconium metal and hafnium metal are produced from zirconium chemical intermediates by one producer in Oregon and one in Utah. (U.S. activity)
The source says
“Zirconium metal and hafnium metal were produced from zirconium chemical intermediates by one producer in Oregon and one in Utah.”
Source: USGS Mineral Commodity Summaries 2026, Zirconium and Hafnium (PDF page 218) (2026-02)
Metal, alloy and chemical
Unwrought zirconium imports came from China (55%), Germany (15%) and Canada (12%) in 2021-24; the United States was a net exporter of zirconium metal. (partly U.S.)
The source says
“Zirconium, unwrought: China, 55%; Germany, 15%; Canada, 12%; France, 7%; and other, 11%.”
“The United States was a net exporter of zirconium metal.”
Source: USGS Mineral Commodity Summaries 2026, Zirconium and Hafnium (PDF page 218) (2026-02)
Components and end use
Ceramics were the leading end use for zircon, followed by foundry sand, refractories and zirconium chemicals. (U.S. role not stated)
The source says
“The leading end use for zircon was ceramics.”
“Other primary uses of zircon included foundry sand, refractories, and zirconium chemicals.”
Source: USGS Mineral Commodity Summaries 2026, Zirconium and Hafnium (PDF page 218) (2026-02)
Recycling
Companies in Oregon and Utah recycle zirconium from new and old scrap. (U.S. activity)
The source says
“Companies in Oregon and Utah recycled zirconium from new scrap generated during metal production and fabrication and (or) from post-commercial old scrap.”
Source: USGS Mineral Commodity Summaries 2026, Zirconium and Hafnium (PDF page 218) (2026-02)
Pilot. Summaries are ours, from official pages; each quoted passage is checked against the saved page. “Bottleneck” (orange dot) is shown only where the quote shows one country dominating the stage or the United States relying on imports for it. “No sourced data yet” means we have not found a source, not that the stage is unproblematic.
Mines, plants and partners
Named facilities with their operators and locations, as each source describes them on the date shown. 5 sourced entries for Zirconium.
Mining
Kenmare Resources PLC
north east coast of Mozambique, Mozambique · Operating
The source says
“Kenmare operates the Moma Titanium Minerals Mine, located on the north east coast of Mozambique.”
“Kenmare began production from Moma in 2007”
“The HMC is transported to the Mineral Separation Plant, where it is separated into four final products: ilmenite, zircon, rutile and Mineral Sands Concentrate.”
Source: Kenmare Resources, The Moma Mine (company website) (2026-10-30)
Tronox
KwaZulu-Natal, South Africa · Status not stated
The source says
“The 1,036-acre (419 hectares) Fairbreeze mine in KwaZulu-Natal, on the east coast of South Africa, delivered its first load of titanium-rich ore in late 2015.”
“Fairbreeze produces high-quality ilmenite to feed the smelters at Tronox KZN Sands Central Processing Complex (CPC), as well as zircon, rutile, and other mining co-products.”
Source: Tronox, KZN Sands Fairbreeze Mine (company website) (2017-07-24)
Ore processing and primary recovery
Tronox
Brand-se-Baai, Western Cape, South Africa · Operating
The source says
“The open-pit mine and concentration plants are situated at Brand-se-Baai, 385km north of Cape Town.”
“Here the ore is mined and processed at the primary concentration plants to produce a mineral concentrate.”
“© 2026 Tronox Holdings Plc.”
Source: Tronox, Namakwa Sands, South Africa (company website) (2026)
Refining and separation
Framatome
Jarrie, France · Status not stated
The source says
“Framatome announced an investment in a new separative capacity on its Jarrie site (France), reinforcing its production of high-quality hafnium and zirconium alloys for the nuclear, aerospace, defense and space industries.”
“Hafnium is a derivative of nuclear grade zirconium production”
Source: Framatome, Framatome strengthens its hafnium production capacity for nuclear, aerospace and space applications (2023-11-30)
Teledyne Wah Chang (Wah Chang)
Millersburg, Oregon, United States · Status not stated
The source says
“This report presents the findings of the third Five-Year Review performed for the Teledyne Wah Chang (Wah Chang) Superfund Site located in Millersburg, Oregon.”
“Wah Chang is an operating”
“which concentrate zircon, hafnium, vanadium, niobium, titanium”
Source: U.S. EPA, Third Five-Year Review Report for the Teledyne Wah Chang Superfund Site (2008-01-08)
A curated list, not a complete register: it shows facilities we could confirm in a source page, and a missing name means we have not sourced it, not that it does not exist. Each quoted passage is checked against the saved page. Partnerships are listed only where the source states them.
Policy and funding
Federal items we track for this mineral, each linked to its original.
Policy timeline and funding
No tagged items for this mineral yet. Browse all items.
Data tables
The USGS figures behind the charts. Click a column heading to sort.
Zirconium: USGS tables
United States
| Measure | Unit | 2024 | 2025 |
|---|---|---|---|
| Net import reliance as a percentage of apparent consumption: Zirconium ores and concentrates | percent | <25 | <25 |
| Production, zirconium ores and concentrates [zirconium oxide (ZrO2) content] | metric tons | <100,000 | <100,000 |
| Imports: Zirconium ores and concentrates (ZrO2 content) | metric tons | 18,900 | 16,000 |
| Imports: Zirconium, compounds | metric tons | — | 1,300 |
| Imports: Zirconium, unwrought, powder, and waste and scrap | metric tons | 493 | 530 |
| Imports: Zirconium, wrought | metric tons | 372 | 380 |
| Exports: Zirconium ores and concentrates (ZrO2 content) | metric tons | 15,400 | 10,000 |
| Exports: Zirconium, unwrought, powder, and waste and scrap | metric tons | 1,180 | 1,300 |
| Exports: Zirconium, wrought | metric tons | 808 | 1,000 |
| Consumption, apparent, zirconium ores and concentrates (ZrO2 content) | metric tons | <100,000 | <100,000 |
| Price: Zirconium, sponge, ex-works China, dollars per kilogram | dollars per kilogram | 24 | 22 |
World production: Zirconium mineral concentrates, mine production (thousand metric tons, gross weight) (thousand metric tons; top 6 of 9, plus other countries)
| Country | 2024 | 2025 | Share |
|---|---|---|---|
| Australia | 400 | 400 | 33% |
| South Africa | 290 | 270 | 22% |
| Mozambique | 124 | 160 | 13% |
| United States | 100 | 100 | 8% |
| China | 100 | 100 | 8% |
| Senegal | 68 | 70 | 6% |
| Other countries | 71 | 40 | 3% |
World total 2025: 1,200 thousand metric tons (as printed by USGS, rounded).
World reserves: Zirconium reserves(thousand metric tons, ZrO2 content) (thousand metric tons; top 6 of 9, plus other countries)
| Country | 2025 |
|---|---|
| Australia | 55000 |
| South Africa | 5,900 |
| Indonesia | 3,400 |
| Senegal | 2,600 |
| Madagascar | 2,100 |
| Mozambique | 1,500 |
| Other countries | 5,700 |
U.S. import sources: Zirconium ores and concentrates (percent of imports, 2021–24)
| Country | Share (%) |
|---|---|
| South Africa | 48 |
| Australia | 35 |
| Senegal | 15 |
| Other countries | 2 |
U.S. import sources: Zirconium, compounds (percent of imports, 2021–24)
| Country | Share (%) |
|---|---|
| China | 41 |
| South Africa | 31 |
| France | 12 |
| Australia | 10 |
| Other countries | 6 |
U.S. import sources: Zirconium, unwrought (percent of imports, 2021–24)
| Country | Share (%) |
|---|---|
| China | 55 |
| Germany | 15 |
| Canada | 12 |
| France | 7 |
| Other countries | 11 |
U.S. import sources: Zirconium, wrought (percent of imports, 2021–24)
| Country | Share (%) |
|---|---|
| France | 72 |
| Germany | 10 |
| Belgium | 7 |
| China | 4 |
| Other countries | 7 |
Source: U.S. Geological Survey, Mineral Commodity Summaries 2026: Zirconium (February 2026)