All fact sheets · The Strata Memo
Uranium
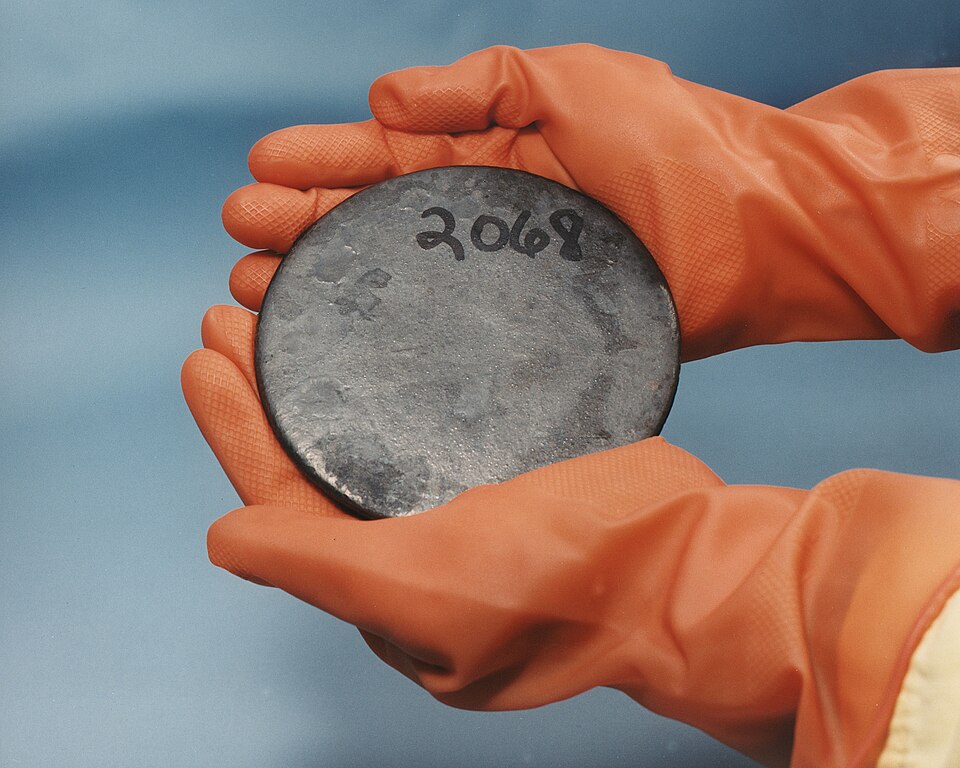

Hover, focus or tap to see the real thing
Photo Unspecified. “HEUraniumC.jpg.” Public domain. Wikimedia Commons. File page
Chemical details
- State at room conditions
- Solid
- Melting point
- 1,408 K (1,135 °C)
- Boiling point
- 4,404 K (4,131 °C)
- Density
- 18.95 g/cm³
- Common oxidation states
- +6, +5, +4, +3
- Electronegativity (Pauling)
- 1.38
- Atomic radius
- 240 pm
- First ionization energy
- 6.194 eV
- Discovered
- 1789
Source: U.S. National Library of Medicine, PubChem, Periodic Table of Elements (element Uranium) (current at retrieval)
On the USGS 2025 List of Critical Minerals. Figures: USGS Mineral Commodity Summaries 2026 (data release, public domain). Estimates are USGS's; check the USGS chapter for notes. Each panel names its source; full citations are in the methodology source register.
Overview
The headline numbers: how much the U.S. depends on imports and how concentrated supply is.
How much does the U.S. import?
of the uranium concentrate (U3O8) used by U.S. nuclear generators in 2023 was imported (EIA).
Source says: “imports accounted for 99% of the ... they used in 2023 to make nuclear fuel”
Not the USGS measure: this is imports as a share of uranium concentrate used by U.S. reactors in 2023, from EIA. USGS publishes no uranium figure. Newer years may differ.
Source: U.S. Energy Information Administration, U.S. nuclear generators import nearly all the uranium concentrate they use (2025-01-30)
Did you know?
Martin Klaproth found uranium in the mineral pitchblende in 1789 and named it after the planet Uranus.
Checked against two independent sources. Verified 2026-10-26.
Sources: Wikipedia · US Department of Energy, Office of Nuclear Energy (Wikipedia text is CC BY-SA)
Supply
Who produces it, where the reserves are, where U.S. imports come from, and how U.S. supply has moved.
Where U.S. imports come from
Choose a data set, then a view. A country keeps the same color in every chart on this page. Grey means other countries, or a country beyond the seven colors (always labeled). Hover or focus a mark for its value, or use the table view.
- Australia80% · $604.2M
- Namibia20% · $146.8M
- Netherlands0% · $52K
| Country | U.S. imports, 2025 | Share of this chart |
|---|---|---|
| Australia | 80% · $604.2M | 80.4% |
| Namibia | 20% · $146.8M | 19.5% |
| Netherlands | 0% · $52K | 0.0% |
U.S. general imports (customs value) in calendar 2025 under HS 2612; countries beyond the top six are grouped. The code can include goods beyond this mineral. The Shift view compares each country's share of 2025 with its share of Jan to Aug 2026 (shares of each period's total).
Source: U.S. Census Bureau, International Trade API: U.S. imports by HS code and country (calendar 2025; Jan to Aug 2026) (data months 2025-12, 2026-08)
- France25% · $1.7B
- United Kingdom20% · $1.4B
- Canada17% · $1.2B
- Russia15% · $1.1B
- Netherlands11% · $749.5M
- Germany6% · $440.1M
- All other countries7% · $489.2M
| Country | U.S. imports, 2025 | Share of this chart |
|---|---|---|
| France | 25% · $1.7B | 24.6% |
| United Kingdom | 20% · $1.4B | 19.5% |
| Canada | 17% · $1.2B | 16.7% |
| Russia | 15% · $1.1B | 15.2% |
| Netherlands | 11% · $749.5M | 10.7% |
| Germany | 6% · $440.1M | 6.3% |
| All other countries | 7% · $489.2M | 7.0% |
U.S. general imports (customs value) in calendar 2025 under HS 2844; countries beyond the top six are grouped. The code can include goods beyond this mineral. The Shift view compares each country's share of 2025 with its share of Jan to Aug 2026 (shares of each period's total).
Source: U.S. Census Bureau, International Trade API: U.S. imports by HS code and country (calendar 2025; Jan to Aug 2026) (data months 2025-12, 2026-08)
Trade and tariffs
Tariff codes and the countries behind U.S. imports and exports.
Trade codes and tariffs
| HTS code | What it covers | Normal rate | Column 2 rate |
|---|---|---|---|
| 2612 | Uranium or thorium ores and concentrates | Free | Free |
| 2844 | Radioactive chemical elements and radioactive isotopes (including the fissile or fertile chemical elements and isotopes) and their compounds; mixtures and residues containing these products | Free to 5.5% | Free to 45% |
Rates from the U.S. Harmonized Tariff Schedule (USITC, saved 2026-10-26). The normal rate is column 1 general; column 2 applies to countries without normal trade relations. A range means different products under the code have different rates. Section 232, Section 301, emergency tariffs and antidumping or countervailing duties are set in separate notices and are not shown. Look up any code at hts.usitc.gov. These are the main codes for this mineral, not a complete list.
Source: U.S. International Trade Commission, Harmonized Tariff Schedule of the United States, general and column 2 rates (edition current when saved)
U.S. trade by country
U.S. imports in 2025 by source country, code 2844
| Name | Value |
|---|---|
| France | 25% · $1.7B |
| United Kingdom | 20% · $1.4B |
| Canada | 17% · $1.2B |
| Russia | 15% · $1.1B |
| Netherlands | 11% · $749.5M |
| Germany | 6% · $440.1M |
U.S. exports in 2025 by destination, code 2844
| Name | Value |
|---|---|
| United Kingdom | 35% · $455.2M |
| Germany | 18% · $235.1M |
| Canada | 10% · $129.3M |
| Netherlands | 10% · $125.9M |
| Japan | 9% · $118.3M |
| Argentina | 3% · $38.1M |
2612 Uranium or thorium ores and concentrates
Top import sources Australia 80%, Namibia 20%, Netherlands 0%
Top export destinations Belgium 100%
2844 Radioactive chemical elements & isotopes etc.
Top import sources France 25%, United Kingdom 20%, Canada 17%
Top export destinations United Kingdom 35%, Germany 18%, Canada 10%
U.S. Census Bureau International Trade API, saved 2026-10-26. Imports are general imports (customs value) and exports are total exports, in U.S. dollars. Duty collected is Census's calculated duty on imports for consumption. Figures cover every 10-digit product under the code, so they can include goods beyond this mineral, and the duty shown is not split into Section 232, Section 301 or antidumping duties. Bars show the largest code for each direction. Group rows such as the EU or OECD are left out so no country is counted twice.
Source: U.S. Census Bureau, International Trade API: U.S. imports and exports by HS code and country (calendar 2025, and January to Aug 2026) (data months 2025-12, 2026-08)
Policy and funding
Federal items we track for this mineral, each linked to its original.
Policy timeline
Tagged by AI from federal sources; each links to the original. How we label.
Source: U.S. federal sources (Federal Register, Grants.gov, DOE, Regulations.gov, DFC), Policy items tagged for Uranium (dates per item)
Federal awards already made
The University of Central Florida Board of Trustees · Department of Energy · $1.1M obligated · started 2026-07-17
Source: usaspending.gov, retrieved 2026-10-29
Spearstone Solutions, LLC · National Science Foundation · $305K obligated · started 2025-03-01
Source: usaspending.gov, retrieved 2026-10-29
Trustees of the Colorado School of Mines · Department of Energy · $300K obligated · started 2026-07-06
Source: usaspending.gov, retrieved 2026-10-29
The 3 largest of 3 AI-tagged awards from USAspending (last 12 months, found by keyword; some are only loosely about this mineral). See all awards for Uranium.
Source: U.S. Department of the Treasury, Bureau of the Fiscal Service, USAspending.gov: spending by award (contracts and grants, last 12 months) (award start dates per item)
Data tables
The USGS figures behind the charts. Click a column heading to sort.
USGS's Mineral Commodity Summaries data release has no figures for Uranium. Not in the MCS data release; USGS does not publish uranium here.