All fact sheets · The Strata Memo
Samarium
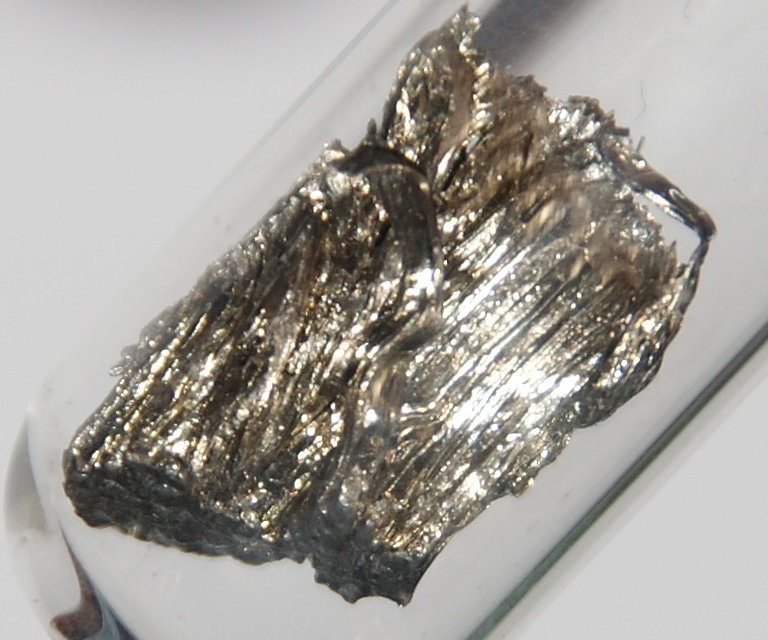

Hover, focus or tap to see the real thing
Photo Unknown author Unknown author. “Samarium-2.jpg.” CC BY 3.0. Wikimedia Commons. File page
Chemical details
- State at room conditions
- Solid
- Melting point
- 1,347 K (1,074 °C)
- Boiling point
- 2,067 K (1,794 °C)
- Density
- 7.52 g/cm³
- Common oxidation states
- +3, +2
- Electronegativity (Pauling)
- 1.17
- Atomic radius
- 229 pm
- First ionization energy
- 5.644 eV
- Discovered
- 1879
Source: U.S. National Library of Medicine, PubChem, Periodic Table of Elements (element Samarium) (current at retrieval)
On the USGS 2025 List of Critical Minerals. Figures: USGS Mineral Commodity Summaries 2026 (data release, public domain). Estimates are USGS's; check the USGS chapter for notes. Each panel names its source; full citations are in the methodology source register.
Overview
The headline numbers: how much the U.S. depends on imports and how concentrated supply is.
How much does the U.S. import?
of U.S. rare earth compounds and metals use was met by imports in 2025 (USGS group figure for all rare earths, not this element alone).
USGS reports the rare earth elements as one group, so this is the group's figure, not this element's.
Source: U.S. Geological Survey, Mineral Commodity Summaries 2026: Rare Earths (February 2026)
Did you know?
Samarium was the first element named after a person, indirectly: it honors a Russian mining official through the mineral samarskite.
Checked against two independent sources. Verified 2026-10-26.
Sources: Wikipedia · Royal Society of Chemistry (RSC Education) (Wikipedia text is CC BY-SA)
Supply
Who produces it, where the reserves are, where U.S. imports come from, and how U.S. supply has moved.
Price
Price, average, dollars per kilogram: Samarium oxide, 99.5% minimum
Source: U.S. Geological Survey, Mineral Commodity Summaries 2026: Samarium (February 2026)
Where U.S. imports come from
Choose a data set, then a view. A country keeps the same color in every chart on this page. Grey means other countries, or a country beyond the seven colors (always labeled). Hover or focus a mark for its value, or use the table view.
- China83% · $6.7M
- Korea, South9% · $722K
- United Kingdom4% · $318K
- Turkey3% · $257K
- Japan1% · $42K
- Hong Kong0% · $12K
| Country | U.S. imports, 2025 | Share of this chart |
|---|---|---|
| China | 83% · $6.7M | 83.2% |
| Korea, South | 9% · $722K | 9.0% |
| United Kingdom | 4% · $318K | 4.0% |
| Turkey | 3% · $257K | 3.2% |
| Japan | 1% · $42K | 0.5% |
| Hong Kong | 0% · $12K | 0.2% |
U.S. general imports (customs value) in calendar 2025 under HS 2805.30; countries beyond the top six are grouped. The code can include goods beyond this mineral. The Shift view compares each country's share of 2025 with its share of Jan to Aug 2026 (shares of each period's total).
Source: U.S. Census Bureau, International Trade API: U.S. imports by HS code and country (calendar 2025; Jan to Aug 2026) (data months 2025-12, 2026-08)
- China54% · $106.4M
- France14% · $28.3M
- Japan13% · $26.1M
- Austria5% · $9.0M
- Germany4% · $7.0M
- South Africa3% · $5.0M
- All other countries8% · $15.3M
| Country | U.S. imports, 2025 | Share of this chart |
|---|---|---|
| China | 54% · $106.4M | 54.0% |
| France | 14% · $28.3M | 14.3% |
| Japan | 13% · $26.1M | 13.3% |
| Austria | 5% · $9.0M | 4.6% |
| Germany | 4% · $7.0M | 3.5% |
| South Africa | 3% · $5.0M | 2.5% |
| All other countries | 8% · $15.3M | 7.8% |
U.S. general imports (customs value) in calendar 2025 under HS 2846; countries beyond the top six are grouped. The code can include goods beyond this mineral. The Shift view compares each country's share of 2025 with its share of Jan to Aug 2026 (shares of each period's total).
Source: U.S. Census Bureau, International Trade API: U.S. imports by HS code and country (calendar 2025; Jan to Aug 2026) (data months 2025-12, 2026-08)
Trade and tariffs
Tariff codes and the countries behind U.S. imports and exports.
Trade codes and tariffs
| HTS code | What it covers | Normal rate | Column 2 rate |
|---|---|---|---|
| 2805.30 | Rare-earth metals, scandium and yttrium, whether or not intermixed or interalloyed | 5% | 31.3% |
| 2846 | Compounds, inorganic or organic, of rare-earth metals, of yttrium or of scandium, or of mixtures of these metals | Free to 5.5% * | 25% to 35% |
Rates from the U.S. Harmonized Tariff Schedule (USITC, saved 2026-10-26). The normal rate is column 1 general; column 2 applies to countries without normal trade relations. A range means different products under the code have different rates. An asterisk means the schedule footnotes point to Chapter 99 additional-duty headings. Section 232, Section 301, emergency tariffs and antidumping or countervailing duties are set in separate notices and are not shown. Look up any code at hts.usitc.gov. These are the main codes for this mineral, not a complete list.
Source: U.S. International Trade Commission, Harmonized Tariff Schedule of the United States, general and column 2 rates (edition current when saved)
U.S. trade by country
U.S. imports in 2025 by source country, code 2846
| Name | Value |
|---|---|
| China | 54% · $106.4M |
| France | 14% · $28.3M |
| Japan | 13% · $26.1M |
| Austria | 5% · $9.0M |
| Germany | 4% · $7.0M |
| South Africa | 3% · $5.0M |
U.S. exports in 2025 by destination, code 2846
| Name | Value |
|---|---|
| China | 32% · $68.6M |
| Vietnam | 27% · $58.2M |
| Thailand | 15% · $32.9M |
| Korea, South | 7% · $15.7M |
| Taiwan | 3% · $6.5M |
| Netherlands | 2% · $3.8M |
2805.30 Rare-earth metal, scandium & yttrium
Top import sources China 83%, Korea, South 9%, United Kingdom 4%
Top export destinations India 29%, Canada 22%, United Kingdom 17%
2846 Rare-earth metal compounds of yttrium or scandium
Top import sources China 54%, France 14%, Japan 13%
Top export destinations China 32%, Vietnam 27%, Thailand 15%
U.S. Census Bureau International Trade API, saved 2026-10-26. Imports are general imports (customs value) and exports are total exports, in U.S. dollars. Duty collected is Census's calculated duty on imports for consumption. Figures cover every 10-digit product under the code, so they can include goods beyond this mineral, and the duty shown is not split into Section 232, Section 301 or antidumping duties. Bars show the largest code for each direction. Group rows such as the EU or OECD are left out so no country is counted twice.
Source: U.S. Census Bureau, International Trade API: U.S. imports and exports by HS code and country (calendar 2025, and January to Aug 2026) (data months 2025-12, 2026-08)
Value chain and risk
Where in the chain the bottlenecks sit, and what other governments and sources say about supply risk.
Value chain: where the bottlenecks are
Mining
Rare earths are mined in the United States: bastnaesite at Mountain Pass, California, and monazite as a sand byproduct in the Southeast. (U.S. activity)
The source says
“Bastnaesite was mined as a primary product in Mountain Pass, CA. Monazite was produced from heavy-mineral-sand concentrates in the southeastern United States.”
Source: USGS Mineral Commodity Summaries 2026, Rare Earths (2026-02)
Ore processing and primary recovery
In 2025 the United States produced rare-earth mineral concentrates, with bastnaesite mined at Mountain Pass, California. (U.S. activity)
The source says
“An estimated 51,000 tons of REO in mineral concentrates was produced and was valued at $240 million. Bastnaesite was mined as a primary product in Mountain Pass, CA.”
Source: USGS Mineral Commodity Summaries 2026, Rare Earths (chapter PDF, printed page 152) (2026)
Refining and separation bottleneck
The United States processes some rare earths, but its imported compounds and metals came 71% from China (2021-24), and the Malaysian, Japanese and Estonian share was made from concentrates and intermediates produced in China and elsewhere. (partly U.S.)
The source says
“Rare earths were mined and processed domestically in 2025.”
“Compounds and metals imported from Estonia, Japan, and Malaysia were derived from mineral concentrates and chemical intermediates produced in Australia, China, and elsewhere.”
Source: USGS Mineral Commodity Summaries 2026, Rare Earths (2026-02)
The Congressional Research Service says China processes and separates about 90% of the world's rare earths. (U.S. role not stated)
The source says
“(PRC, or China) mines about 60% and processes and separates about 90% of global REEs.”
Source: CRS In Focus IF13171, Rare Earth Elements and U.S. Supply Chains (2026-03-04)
The Section 232 proclamation says U.S. rare earth oxides must be exported for further refining and processing before being reimported. (partly U.S.)
The source says
“the United States' limited processing capacity still requires rare earth oxides to be exported for further refining and processing before being reimported for domestic use”
Source: White House proclamation, Adjusting Imports of Processed Critical Minerals and Their Derivative Products (Section 232) (2026-01-14)
Metal, alloy and chemical bottleneck
China's April 2025 controls cover alloys, compounds, metals and oxides of seven rare earths: samarium, gadolinium, terbium, dysprosium, lutetium, scandium and yttrium. (U.S. role not stated)
The source says
“China tightened its export controls on rare-earth elements, adding specific controls on alloys, compounds, metals, and oxides of samarium, gadolinium, terbium, dysprosium, lutetium, scandium, and yttrium.”
Source: USGS Mineral Commodity Summaries 2026, Rare Earths (2026-02)
The Congressional Research Service says China makes about 94% of rare-earth magnets. (U.S. role not stated)
The source says
“It also manufactures about 94% of REE-based magnets.”
Source: CRS In Focus IF13171, Rare Earth Elements and U.S. Supply Chains (2026-03-04)
The proclamation says the United States relies entirely on imports of rare earth permanent magnets for commercial demand and that U.S. production meets only a fraction of defense needs. (partly U.S.)
The source says
“the United States is too entirely reliant on imports of rare earth permanent magnets to meet commercial demand, and United States production currently meets only a fraction of defense needs”
Source: White House proclamation, Adjusting Imports of Processed Critical Minerals and Their Derivative Products (Section 232) (2026-01-14)
Components and end use
Magnets are the leading global use, catalysts the leading U.S. use, and much imported rare-earth content arrives inside finished goods. (U.S. role not stated)
The source says
“the estimated leading domestic end use of rare earths was catalysts, whereas the estimated leading global use was magnets.”
“A significant amount of imported rare earths was embedded in finished goods.”
Source: USGS Mineral Commodity Summaries 2026, Rare Earths (2026-02)
Recycling
Only limited quantities are recovered, from batteries, permanent magnets and fluorescent lamps. (partly U.S.)
The source says
“Limited quantities of rare earths were recovered from batteries, permanent magnets, and fluorescent lamps.”
Source: USGS Mineral Commodity Summaries 2026, Rare Earths (2026-02)
Pilot. Summaries are ours, from official pages; each quoted passage is checked against the saved page. “Bottleneck” (orange dot) is shown only where the quote shows one country dominating the stage or the United States relying on imports for it. “No sourced data yet” means we have not found a source, not that the stage is unproblematic.
Mines, plants and partners
Named facilities with their operators and locations, as each source describes them on the date shown. 1 sourced entry for Samarium.
Refining and separation
MP Materials Corp.
Mountain Pass, San Bernardino County, California, United States · Operating
The source says
“owns and operates the Mountain Pass Rare Earth Mine and Processing Facility (“Mountain Pass”) located near Mountain Pass, San Bernardino County, California”
“Through its midstream operations, the Company produces NdPr oxide and other separated rare earth products, including cerium and lanthanum products, as well as SEG+, a mixed heavy rare earth product.”
“samarium, europium, and gadolinium (“SEG+”) precipitate”
Source: MP Materials Corp., Form 10-K for fiscal year 2025 (SEC EDGAR) (2026-02-26)
A curated list, not a complete register: it shows facilities we could confirm in a source page, and a missing name means we have not sourced it, not that it does not exist. Each quoted passage is checked against the saved page. Partnerships are listed only where the source states them.
Geopolitics and supply risk
Export controls by other countries
In April 2025 China added specific export controls on alloys, compounds, metals and oxides of these seven elements.
The source says
“In April 2025, China tightened its export controls on rare-earth elements, adding specific controls on alloys, compounds, metals, and oxides of samarium, gadolinium, terbium, dysprosium, lutetium, scandium, and yttrium.”
Source: USGS Mineral Commodity Summaries 2026, Rare earths (2026-02)
The April 2025 Chinese controls stayed in force, though China began issuing general export licenses to selected exporters.
The source says
“The April export controls remained in effect, although China began to issue general export licenses to selected exporters.”
Source: USGS Mineral Commodity Summaries 2026, Rare earths (2026-02)
Summaries are ours, from official pages. Each quoted passage is checked against the saved source page. This is a curated list for the edition shown, not a complete or current record of every measure.
Policy and funding
Federal items we track for this mineral, each linked to its original.
Federal awards already made
Rensselaer Polytechnic Institute · Department of Energy · $700K obligated · started 2026-07-14
Source: usaspending.gov, retrieved 2026-10-29
The 1 largest of 1 AI-tagged awards from USAspending (last 12 months, found by keyword; some are only loosely about this mineral). See all awards for Samarium.
Source: U.S. Department of the Treasury, Bureau of the Fiscal Service, USAspending.gov: spending by award (contracts and grants, last 12 months) (award start dates per item)
Data tables
The USGS figures behind the charts. Click a column heading to sort.
Samarium: USGS tables
United States
| Measure | Unit | 2024 | 2025 |
|---|---|---|---|
| Price, average, dollars per kilogram: Samarium oxide, 99.5% minimum | dollars per kilogram | 2.01 | 2.82 |
Source: U.S. Geological Survey, Mineral Commodity Summaries 2026: Samarium (February 2026)
Rare Earths: USGS tables
USGS reports rare earths as a group; these figures are for the whole group, not for Samarium alone.
United States
| Measure | Unit | 2024 | 2025 |
|---|---|---|---|
| Net import reliance as a percentage of apparent consumption: Compounds and metals | percent | 53 | 67 |
| Net import reliance as a percentage of apparent consumption: Mineral concentrates | percent | E | E |
| Production: Mineral concentrates | metric tons | 45,500 | 51,000 |
| Production: Compounds and metals | metric tons | 4,300 | 8,900 |
| Imports: Compounds | metric tons | 8,120 | 21,000 |
| Imports: Metals: Ferrocerium, alloys | metric tons | 238 | 1,100 |
| Imports: Metals: Rare-earth metals and alloys | metric tons | 96 | 350 |
| Exports: Ores and compounds | metric tons | 37,500 | 14,000 |
| Exports: Metals: Ferrocerium, alloys | metric tons | 902 | 890 |
| Exports: Metals: Rare-earth metals and alloys | metric tons | 347 | 430 |
| Consumption, apparent, compounds and metals | metric tons | 9,010 | 27,000 |
| Price, average, dollars per kilogram: Mischmetal, 65% cerium, 35% lanthanum | dollars per kilogram | 5.45 | 5.62 |
| Price, average, dollars per kilogram: Neodymium-praseodymium (NdPr) oxide, 99% minimum | dollars per kilogram | 55 | 69 |
| Employment, mine and mill, annual average, number | number | 570 | 670 |
World production (metric tons; top 6 of 16, plus other countries)
| Country | 2024 | 2025 | Share |
|---|---|---|---|
| China | 270,000 | 270,000 | 69% |
| United States | 45,500 | 51,000 | 13% |
| Australia | 29,000 | 29,000 | 7% |
| Burma | 27,000 | 22,000 | 6% |
| Thailand | 2,100 | 4,800 | 1% |
| India | 2,900 | 2,900 | 1% |
| Other countries | 1,000 | 550 | 0% |
World total 2025: 390,000 metric tons (as printed by USGS, rounded).
World reserves (metric tons; top 6 of 16, plus other countries)
| Country | 2025 |
|---|---|
| China | 44,000,000 |
| Brazil | 21,000,000 |
| Australia | 6,300,000 |
| Russia | 3,800,000 |
| Vietnam | 3,500,000 |
| United States | 1,900,000 |
| Other countries | NA |
U.S. import sources: Rare-earth compounds and metals (percent of imports, 2021–24)
| Country | Share (%) |
|---|---|
| China | 71 |
| Malaysia | 13 |
| Japan | 5 |
| Estonia | 5 |
| Other countries | 6 |
Source: U.S. Geological Survey, Mineral Commodity Summaries 2026: Rare Earths (February 2026)