All fact sheets · The Strata Memo
Magnesium
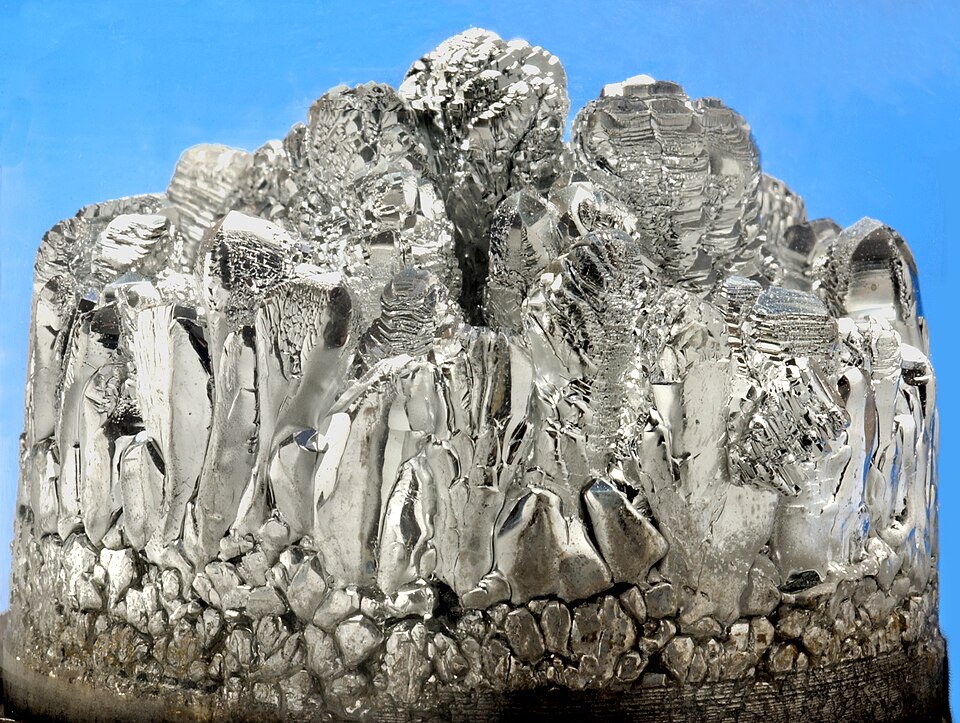

Hover, focus or tap to see the real thing
Photo Mark Fergus, CSIRO. “CSIRO ScienceImage 2893 Crystalised magnesium.jpg.” CC BY 3.0. Wikimedia Commons. File page
Chemical details
- State at room conditions
- Solid
- Melting point
- 923 K (650 °C)
- Boiling point
- 1,363 K (1,090 °C)
- Density
- 1.74 g/cm³
- Common oxidation states
- +2
- Electronegativity (Pauling)
- 1.31
- Atomic radius
- 173 pm
- First ionization energy
- 7.646 eV
- Discovered
- 1808
Source: U.S. National Library of Medicine, PubChem, Periodic Table of Elements (element Magnesium) (current at retrieval)
On the USGS 2025 List of Critical Minerals. Figures: USGS Mineral Commodity Summaries 2026 (data release, public domain). Estimates are USGS's; check the USGS chapter for notes. Each panel names its source; full citations are in the methodology source register.
Overview
The headline numbers: how much the U.S. depends on imports and how concentrated supply is.
How much does the U.S. import?
of U.S. magnesium use was met by imports in 2025 (USGS net import reliance).
Source: U.S. Geological Survey, Mineral Commodity Summaries 2026: Magnesium Metal (February 2026)
Did you know?
The Germans coined the name "Elektron" for magnesium alloys, and it survives today: a magnesium alloy company still carries it in its name.
Two sources; the second is less authoritative or covers it loosely. Verified 2026-10-29.
Sources: Wikipedia · Luxfer MEL Technologies (Magnesium Elektron) company history (Wikipedia text is CC BY-SA)
How concentrated is supply?
94% of world production comes from three countries (China, Russia, Brazil). Highly concentrated.
Thirds of the bar: under 33%, 33 to 65%, 66% and over. Our own rule of thumb, not a USGS rating.
Source: U.S. Geological Survey, Mineral Commodity Summaries 2026: Magnesium Metal (February 2026)
Supply
Who produces it, where the reserves are, where U.S. imports come from, and how U.S. supply has moved.
Who has it, and who digs it?
Where it is produced, 2025 (Smelter production)
| Name | Value |
|---|---|
| China | 86% |
| Russia | 5% |
| Brazil | 2% |
| Israel | 2% |
| Turkey | 1% |
| Kazakhstan | 1% |
Share of the world total as printed by USGS (rounded). Production and reserves are different things: reserves are what is economic to mine. Hover or focus a bar for its value, or switch to the table view.
Source: U.S. Geological Survey, Mineral Commodity Summaries 2026: Magnesium Metal (February 2026)
Where U.S. imports come from
Choose a data set, then a view. A country keeps the same color in every chart on this page. Grey means other countries, or a country beyond the seven colors (always labeled). Hover or focus a mark for its value, or use the table view.
- Israel47%
- Turkey31%
- Russia8%
- China6%
- Other countries8%
| Country | Share of U.S. imports | Share of this chart |
|---|---|---|
| Israel | 47% | 47.0% |
| Turkey | 31% | 31.0% |
| Russia | 8% | 8.0% |
| China | 6% | 6.0% |
| Other countries | 8% | 8.0% |
Average share of U.S. imports of magnesium metal (99.8% purity), 2021–24, as printed by USGS (rounded, so shares may not sum to 100). Other countries are USGS's own grouping.
Source: U.S. Geological Survey, Mineral Commodity Summaries 2026: Magnesium Metal (February 2026)
- Czechia26%
- Korea, Republic of20%
- Israel11%
- Taiwan11%
- Other countries32%
| Country | Share of U.S. imports | Share of this chart |
|---|---|---|
| Czechia | 26% | 26.0% |
| Korea, Republic of | 20% | 20.0% |
| Israel | 11% | 11.0% |
| Taiwan | 11% | 11.0% |
| Other countries | 32% | 32.0% |
Average share of U.S. imports of magnesium alloys (magnesium content), 2021–24, as printed by USGS (rounded, so shares may not sum to 100). Other countries are USGS's own grouping.
Source: U.S. Geological Survey, Mineral Commodity Summaries 2026: Magnesium Metal (February 2026)
- Mexico30%
- Austria23%
- China17%
- Taiwan9%
- Other countries21%
| Country | Share of U.S. imports | Share of this chart |
|---|---|---|
| Mexico | 30% | 30.0% |
| Austria | 23% | 23.0% |
| China | 17% | 17.0% |
| Taiwan | 9% | 9.0% |
| Other countries | 21% | 21.0% |
Average share of U.S. imports of sheet, powder, and other (magnesium content), 2021–24, as printed by USGS (rounded, so shares may not sum to 100). Other countries are USGS's own grouping.
Source: U.S. Geological Survey, Mineral Commodity Summaries 2026: Magnesium Metal (February 2026)
- Canada36%
- Mexico15%
- China14%
- India8%
- Other countries27%
| Country | Share of U.S. imports | Share of this chart |
|---|---|---|
| Canada | 36% | 36.0% |
| Mexico | 15% | 15.0% |
| China | 14% | 14.0% |
| India | 8% | 8.0% |
| Other countries | 27% | 27.0% |
Average share of U.S. imports of scrap, 2021–24, as printed by USGS (rounded, so shares may not sum to 100). Other countries are USGS's own grouping.
Source: U.S. Geological Survey, Mineral Commodity Summaries 2026: Magnesium Metal (February 2026)
- Israel20%
- Canada15%
- Turkey11%
- Czechia9%
- Other countries45%
| Country | Share of U.S. imports | Share of this chart |
|---|---|---|
| Israel | 20% | 20.0% |
| Canada | 15% | 15.0% |
| Turkey | 11% | 11.0% |
| Czechia | 9% | 9.0% |
| Other countries | 45% | 45.0% |
Average share of U.S. imports of combined total (includes magnesium content of alloys, metal, powder, scrap, sheet, and other), 2021–24, as printed by USGS (rounded, so shares may not sum to 100). Other countries are USGS's own grouping.
Source: U.S. Geological Survey, Mineral Commodity Summaries 2026: Magnesium Metal (February 2026)
- China53% · $128.7M
- Canada11% · $27.5M
- Brazil10% · $23.7M
- Israel8% · $19.1M
- Mexico6% · $13.5M
- Japan5% · $11.5M
- All other countries9% · $21.0M
| Country | U.S. imports, 2025 | Share of this chart |
|---|---|---|
| China | 53% · $128.7M | 52.5% |
| Canada | 11% · $27.5M | 11.2% |
| Brazil | 10% · $23.7M | 9.7% |
| Israel | 8% · $19.1M | 7.8% |
| Mexico | 6% · $13.5M | 5.5% |
| Japan | 5% · $11.5M | 4.7% |
| All other countries | 9% · $21.0M | 8.6% |
U.S. general imports (customs value) in calendar 2025 under HS 2519; countries beyond the top six are grouped. The code can include goods beyond this mineral. The Shift view compares each country's share of 2025 with its share of Jan to Aug 2026 (shares of each period's total).
Source: U.S. Census Bureau, International Trade API: U.S. imports by HS code and country (calendar 2025; Jan to Aug 2026) (data months 2025-12, 2026-08)
- Israel21% · $71.0M
- Korea, South14% · $47.9M
- Turkey10% · $33.8M
- Czech Republic10% · $32.4M
- Canada8% · $27.0M
- United Kingdom8% · $26.7M
- All other countries29% · $99.9M
| Country | U.S. imports, 2025 | Share of this chart |
|---|---|---|
| Israel | 21% · $71.0M | 21.0% |
| Korea, South | 14% · $47.9M | 14.1% |
| Turkey | 10% · $33.8M | 10.0% |
| Czech Republic | 10% · $32.4M | 9.6% |
| Canada | 8% · $27.0M | 8.0% |
| United Kingdom | 8% · $26.7M | 7.9% |
| All other countries | 29% · $99.9M | 29.5% |
U.S. general imports (customs value) in calendar 2025 under HS 8104; countries beyond the top six are grouped. The code can include goods beyond this mineral. The Shift view compares each country's share of 2025 with its share of Jan to Aug 2026 (shares of each period's total).
Source: U.S. Census Bureau, International Trade API: U.S. imports by HS code and country (calendar 2025; Jan to Aug 2026) (data months 2025-12, 2026-08)
U.S. supply mix
thousand metric tons, 2021 to 2025
Imports are before exports, so the stack is not the same as U.S. consumption.
Source: U.S. Geological Survey, Mineral Commodity Summaries 2026: Magnesium Metal (February 2026)
Price
Price, annual average: U.S. spot Western, dollars per pound
Source: U.S. Geological Survey, Mineral Commodity Summaries 2026: Magnesium Metal (February 2026)
Trade and tariffs
Tariff codes and the countries behind U.S. imports and exports.
Trade codes and tariffs
| HTS code | What it covers | Normal rate | Column 2 rate |
|---|---|---|---|
| 2519 | Natural magnesium carbonate (magnesite); fused magnesia; dead-burned (sintered) magnesia, whether or not containing small quantities of other oxides added before sintering; other magnesium oxide, whether or not pure | Free * | varies, $10.33/t; $20.70/t; 1.7¢/kg... |
| 8104 | Magnesium and articles thereof, including waste and scrap | varies, 14.8¢/kg on magnesium content + 3.5%; 4.4%; 6.5%... | varies, 100%; 60.5%; 88¢/kg on magnesium content + 20%... |
Rates from the U.S. Harmonized Tariff Schedule (USITC, saved 2026-10-26). The normal rate is column 1 general; column 2 applies to countries without normal trade relations. A range means different products under the code have different rates. An asterisk means the schedule footnotes point to Chapter 99 additional-duty headings. Section 232, Section 301, emergency tariffs and antidumping or countervailing duties are set in separate notices and are not shown. Look up any code at hts.usitc.gov. These are the main codes for this mineral, not a complete list.
Source: U.S. International Trade Commission, Harmonized Tariff Schedule of the United States, general and column 2 rates (edition current when saved)
U.S. trade by country
U.S. imports in 2025 by source country, code 8104
| Name | Value |
|---|---|
| Israel | 21% · $71.0M |
| Korea, South | 14% · $47.9M |
| Turkey | 10% · $33.8M |
| Czech Republic | 10% · $32.4M |
| Canada | 8% · $27.0M |
| United Kingdom | 8% · $26.7M |
U.S. exports in 2025 by destination, code 8104
| Name | Value |
|---|---|
| Mexico | 35% · $18.7M |
| Canada | 18% · $9.9M |
| United Kingdom | 16% · $8.5M |
| Singapore | 4% · $2.3M |
| Ireland | 4% · $2.1M |
| Israel | 4% · $2.0M |
2519 Magnesite; fused magnesia; d-b magn; m oxide nesoi
Top import sources China 53%, Canada 11%, Brazil 10%
Top export destinations Canada 27%, Korea, South 11%, Mexico 10%
8104 Magnesium & articles thereof, incl waste & scrap
Top import sources Israel 21%, Korea, South 14%, Turkey 10%
Top export destinations Mexico 35%, Canada 18%, United Kingdom 16%
U.S. Census Bureau International Trade API, saved 2026-10-26. Imports are general imports (customs value) and exports are total exports, in U.S. dollars. Duty collected is Census's calculated duty on imports for consumption. Figures cover every 10-digit product under the code, so they can include goods beyond this mineral, and the duty shown is not split into Section 232, Section 301 or antidumping duties. Bars show the largest code for each direction. Group rows such as the EU or OECD are left out so no country is counted twice.
Source: U.S. Census Bureau, International Trade API: U.S. imports and exports by HS code and country (calendar 2025, and January to Aug 2026) (data months 2025-12, 2026-08)
Value chain and risk
Where in the chain the bottlenecks sit, and what other governments and sources say about supply risk.
Value chain: where the bottlenecks are
Mining
Magnesite (a magnesium ore) was mined in the United States by one company in Nevada, while China was the dominant source of U.S. crude magnesite imports. (partly U.S.)
The source says
“Magnesite was mined by one company in Nevada.”
“Crude magnesite: China,5 91%; Japan, 5%; and other, 4%.”
Source: U.S. Geological Survey, Mineral Commodity Summaries 2026 (Magnesium Compounds) (2026)
Ore processing and primary recovery
Most U.S. magnesium compounds were recovered from seawater and natural brines at sites in several states. (U.S. activity)
The source says
“In 2025, most U.S. magnesium compounds were produced from seawater and natural brines.”
“Magnesium compounds were recovered from seawater by one company in California and another company in Delaware, from well brines by one company in Michigan, and from lake brines by two companies in Utah.”
Source: U.S. Geological Survey, Mineral Commodity Summaries 2026 (Magnesium Compounds) (2026)
Refining and separation bottleneck
The only U.S. primary magnesium smelter, in Utah, stopped producing in 2022, and its operator filed for Chapter 11 bankruptcy protection in September 2025. (no U.S. activity)
The source says
“One company in Utah had a smelter to recover primary magnesium from brines from the Great Salt Lake in Utah by an electrolytic process but production was reported to have stopped in 2022.”
“In September 2025, the operator of the only U.S. primary magnesium smelter located in Utah filed for Chapter 11 bankruptcy protection.”
Source: USGS Mineral Commodity Summaries 2026, Magnesium Metal (2026-02)
Metal, alloy and chemical
Imports of magnesium metal came mainly from Israel (47%) and Turkey (31%) in 2021-24, with China at 6%. (partly U.S.)
The source says
“Magnesium metal (99.8% purity): Israel, 47%; Turkey, 31%; Russia, 8%; China, 6%; and other, 8%.”
Source: USGS Mineral Commodity Summaries 2026, Magnesium Metal (2026-02)
Components and end use
Castings, mainly for automobiles, took about 69% of primary magnesium use in 2025. (U.S. role not stated)
The source says
“an estimated 69% of primary magnesium consumption was used in castings, principally for the automotive industry.”
Source: USGS Mineral Commodity Summaries 2026, Magnesium Metal (2026-02)
Recycling
About 108,000 tons of secondary magnesium was recovered in 2025: 26,000 tons from old scrap and 82,000 tons from new scrap. (U.S. activity)
The source says
“about 26,000 tons of secondary magnesium was recovered from old scrap and 82,000 tons was recovered from new scrap.”
Source: USGS Mineral Commodity Summaries 2026, Magnesium Metal (2026-02)
Pilot. Summaries are ours, from official pages; each quoted passage is checked against the saved page. “Bottleneck” (orange dot) is shown only where the quote shows one country dominating the stage or the United States relying on imports for it. “No sourced data yet” means we have not found a source, not that the stage is unproblematic.
Mines, plants and partners
Named facilities with their operators and locations, as each source describes them on the date shown. 3 sourced entries for Magnesium.
Mining
Premier Magnesia LLC
Gabbs, Nevada, United States · Operating
The source says
“For over 50 years, the Company and its predecessors have owned and operated a magnesia mine and processing plant located in Gabbs, Nevada”
Source: Premier Magnesia, About Premier Magnesia (2026)
Refining and separation
US Magnesium (parent The Renco Group Inc.)
near Skull Valley / Great Salt Lake, Tooele County, Utah, United States · Idle
The source says
“Utah has successfully bid to seize control of the defunct US Magnesium plant, and it plans to donate the massive volume of water it evaporated each year to benefit the Great Salt Lake.”
“The US Magnesium plant had been shut down since 2021”
“US Magnesium’s parent company, New York-based The Renco Group Inc.”
Source: The Salt Lake Tribune (with Grist), Utah buys bankrupt U.S. Magnesium plant near Great Salt Lake (2026-01-27)
Magrathea Metals, Inc. (proposed joint venture with TETRA Technologies, Inc.)
TETRA Evergreen Project near Stamps, Southwest Arkansas, United States · Planned
The source says
“to rebuild America's magnesium metal defense industrial base at TETRA's Evergreen Project in Southwest Arkansas.”
“Magrathea has already secured Defense Production Act Title III funding from the Department of War to support its Commercial Phase 1, planned to be on-site at TETRA's Evergreen Plant.”
Source: TETRA Technologies via PR Newswire, TETRA Technologies, Inc. and Magrathea Metals, Inc. Advance Joint Venture Plans to Produce Magnesium in Arkansas (2025-12-02)
A curated list, not a complete register: it shows facilities we could confirm in a source page, and a missing name means we have not sourced it, not that it does not exist. Each quoted passage is checked against the saved page. Partnerships are listed only where the source states them.
Geopolitics and supply risk
U.S. policy and funding
In 2024 the Department of War awarded $19.6 million in Defense Production Act Title III financing to a California company piloting magnesium from brines.
The source says
“In February 2024, the U.S. Department of War (DOW) awarded $19.6 million in financing to the company through the Defense Production Act, Title III, program.”
Source: USGS Mineral Commodity Summaries 2026, Magnesium metal (2026-02)
Supply events
The only U.S. primary magnesium smelter filed for bankruptcy in September 2025, after primary production had stopped in 2022.
The source says
“In September 2025, the operator of the only U.S. primary magnesium smelter located in Utah filed for Chapter 11 bankruptcy protection.”
“After primary production of magnesium stopped”
Source: USGS Mineral Commodity Summaries 2026, Magnesium metal (2026-02)
Summaries are ours, from official pages. Each quoted passage is checked against the saved source page. This is a curated list for the edition shown, not a complete or current record of every measure.
Policy and funding
Federal items we track for this mineral, each linked to its original.
Policy timeline
Tagged by AI from federal sources; each links to the original. How we label.
Source: U.S. federal sources (Federal Register, Grants.gov, DOE, Regulations.gov, DFC), Policy items tagged for Magnesium (dates per item)
Federal awards already made
University of Houston System · Department of Energy · $3.4M obligated · started 2022-06-27
Source: usaspending.gov, retrieved 2026-10-29
Princeton Critical Minerals, Inc. · Department of Energy · $2.3M obligated · started 2026-04-03
Source: usaspending.gov, retrieved 2026-10-29
Board of Regents of Nevada System of Higher Education · Department of the Interior · $444.1K obligated · started 2025-09-01
Source: usaspending.gov, retrieved 2026-10-29
University of Oklahoma · Department of the Interior · $330K obligated · started 2026-03-01
Source: usaspending.gov, retrieved 2026-10-29
The 4 largest of 4 AI-tagged awards from USAspending (last 12 months, found by keyword; some are only loosely about this mineral). See all awards for Magnesium.
Source: U.S. Department of the Treasury, Bureau of the Fiscal Service, USAspending.gov: spending by award (contracts and grants, last 12 months) (award start dates per item)
Data tables
The USGS figures behind the charts. Click a column heading to sort.
Magnesium Metal: USGS tables
United States
| Measure | Unit | 2024 | 2025 |
|---|---|---|---|
| Net import reliance as a percentage of apparent consumption | percent | >50 | >75 |
| Production: Primary | thousand metric tons | — | — |
| Production: Secondary (new and old scrap) | thousand metric tons | 109 | 110 |
| Imports for consumption | thousand metric tons | 70 | 82 |
| Exports | thousand metric tons | 5 | 3 |
| Consumption: Reported, primary | thousand metric tons | 46 | 40 |
| Consumption: Apparent | thousand metric tons | W | W |
| Price, annual average: U.S. spot Western, dollars per pound | dollars per pound | 3.52 | 3.2 |
| Price, annual average: European free market, dollars per metric ton | dollars per metric ton | 2,850 | 2,500 |
| Stocks, producer, yearend | thousand metric tons | W | W |
| Employment, number | number | 200 | — |
World production: Smelter production (thousand metric tons; top 6 of 8, plus other countries)
| Country | 2024 | 2025 | Share |
|---|---|---|---|
| China | 953 | 950 | 86% |
| Russia | 59 | 60 | 5% |
| Brazil | 20 | 20 | 2% |
| Israel | 17 | 20 | 2% |
| Turkey | 15 | 15 | 1% |
| Kazakhstan | 15 | 13 | 1% |
| Other countries | — | — |
World total 2025: 1,100 thousand metric tons (as printed by USGS, rounded).
U.S. import sources: Magnesium metal (99.8% purity) (percent of imports, 2021–24)
| Country | Share (%) |
|---|---|
| Israel | 47 |
| Turkey | 31 |
| Russia | 8 |
| China | 6 |
| Other countries | 8 |
U.S. import sources: Magnesium alloys (magnesium content) (percent of imports, 2021–24)
| Country | Share (%) |
|---|---|
| Czechia | 26 |
| Korea, Republic of | 20 |
| Israel | 11 |
| Taiwan | 11 |
| Other countries | 32 |
U.S. import sources: Sheet, powder, and other (magnesium content) (percent of imports, 2021–24)
| Country | Share (%) |
|---|---|
| Mexico | 30 |
| Austria | 23 |
| China | 17 |
| Taiwan | 9 |
| Other countries | 21 |
U.S. import sources: Scrap (percent of imports, 2021–24)
| Country | Share (%) |
|---|---|
| Canada | 36 |
| Mexico | 15 |
| China | 14 |
| India | 8 |
| Other countries | 27 |
U.S. import sources: Combined total (includes magnesium content of alloys, metal, powder, scrap, sheet, and other) (percent of imports, 2021–24)
| Country | Share (%) |
|---|---|
| Israel | 20 |
| Canada | 15 |
| Turkey | 11 |
| Czechia | 9 |
| Other countries | 45 |
Note: Magnesium compounds (a separate MCS chapter) are not on the critical list.
Source: U.S. Geological Survey, Mineral Commodity Summaries 2026: Magnesium Metal (February 2026)