All fact sheets · The Strata Memo
Lithium
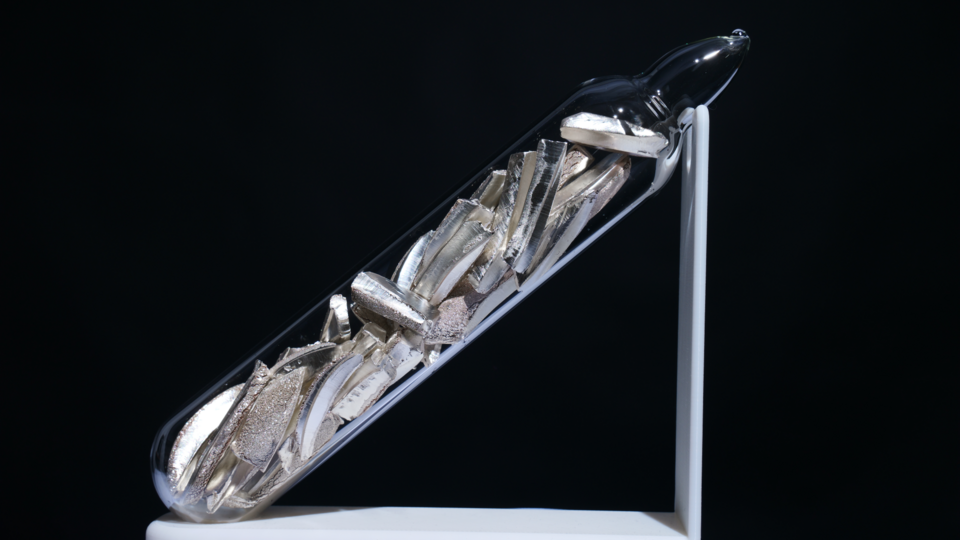

Hover, focus or tap to see the real thing
Photo AdvancedTinkering. “Purified lithium in an ampoule under argon, dark background.png.” CC BY-SA 4.0. Wikimedia Commons. File page
Chemical details
- State at room conditions
- Solid
- Melting point
- 454 K (180 °C)
- Boiling point
- 1,615 K (1,342 °C)
- Density
- 0.534 g/cm³
- Common oxidation states
- +1
- Electronegativity (Pauling)
- 0.98
- Atomic radius
- 182 pm
- First ionization energy
- 5.392 eV
- Discovered
- 1817
Source: U.S. National Library of Medicine, PubChem, Periodic Table of Elements (element Lithium) (current at retrieval)
On the USGS 2025 List of Critical Minerals. Figures: USGS Mineral Commodity Summaries 2026 (data release, public domain). Estimates are USGS's; check the USGS chapter for notes. Each panel names its source; full citations are in the methodology source register.
Overview
The headline numbers: how much the U.S. depends on imports and how concentrated supply is.
How much does the U.S. import?
of U.S. lithium use was met by imports in 2025 (USGS net import reliance).
Source: U.S. Geological Survey, Mineral Commodity Summaries 2026: Lithium (February 2026)
Did you know?
Lithium is the lightest of all metals: light enough to float on water, with a density only about half that of water.
Checked against two independent sources. Verified 2026-10-26.
Sources: Wikipedia · Los Alamos National Laboratory (Wikipedia text is CC BY-SA)
How concentrated is supply?
72% of world production comes from three countries (Australia, China, Chile). Highly concentrated.
Thirds of the bar: under 33%, 33 to 65%, 66% and over. Our own rule of thumb, not a USGS rating.
Source: U.S. Geological Survey, Mineral Commodity Summaries 2026: Lithium (February 2026)
Supply
Who produces it, where the reserves are, where U.S. imports come from, and how U.S. supply has moved.
Who has it, and who digs it?
Where it is produced, 2025
| Name | Value |
|---|---|
| Australia | 32% |
| China | 21% |
| Chile | 19% |
| Zimbabwe | 10% |
| Argentina | 8% |
| Brazil | 4% |
Where the reserves are
| Name | Value |
|---|---|
| Chile | 25% |
| Australia | 23% |
| China | 12% |
| United States | 12% |
| Argentina | 12% |
| Canada | 4% |
Share of the world total as printed by USGS (rounded). Production and reserves are different things: reserves are what is economic to mine. Hover or focus a bar for its value, or switch to the table view.
Source: U.S. Geological Survey, Mineral Commodity Summaries 2026: Lithium (February 2026)
Where U.S. imports come from
Choose a data set, then a view. A country keeps the same color in every chart on this page. Grey means other countries, or a country beyond the seven colors (always labeled). Hover or focus a mark for its value, or use the table view.
- Chile54%
- Argentina43%
- Other countries3%
| Country | Share of U.S. imports | Share of this chart |
|---|---|---|
| Chile | 54% | 54.0% |
| Argentina | 43% | 43.0% |
| Other countries | 3% | 3.0% |
Average share of U.S. imports of all forms, 2021–24, as printed by USGS (rounded, so shares may not sum to 100). Other countries are USGS's own grouping.
Source: U.S. Geological Survey, Mineral Commodity Summaries 2026: Lithium (February 2026)
- Chile82% · $9.6M
- Australia11% · $1.3M
- China4% · $422K
- Germany2% · $181K
- Poland1% · $98K
- Argentina0% · $59K
- All other countries1% · $113K
| Country | U.S. imports, 2025 | Share of this chart |
|---|---|---|
| Chile | 82% · $9.6M | 81.5% |
| Australia | 11% · $1.3M | 11.1% |
| China | 4% · $422K | 3.6% |
| Germany | 2% · $181K | 1.5% |
| Poland | 1% · $98K | 0.8% |
| Argentina | 0% · $59K | 0.5% |
| All other countries | 1% · $113K | 1.0% |
U.S. general imports (customs value) in calendar 2025 under HS 2825.20; countries beyond the top six are grouped. The code can include goods beyond this mineral. The Shift view compares each country's share of 2025 with its share of Jan to Aug 2026 (shares of each period's total).
Source: U.S. Census Bureau, International Trade API: U.S. imports by HS code and country (calendar 2025; Jan to Aug 2026) (data months 2025-12, 2026-08)
- Argentina56% · $89.5M
- Chile43% · $68.2M
- France1% · $1.0M
- United Kingdom0% · $662K
- China0% · $232K
- India0% · $101K
| Country | U.S. imports, 2025 | Share of this chart |
|---|---|---|
| Argentina | 56% · $89.5M | 56.0% |
| Chile | 43% · $68.2M | 42.7% |
| France | 1% · $1.0M | 0.6% |
| United Kingdom | 0% · $662K | 0.4% |
| China | 0% · $232K | 0.1% |
| India | 0% · $101K | 0.1% |
U.S. general imports (customs value) in calendar 2025 under HS 2836.91; countries beyond the top six are grouped. The code can include goods beyond this mineral. The Shift view compares each country's share of 2025 with its share of Jan to Aug 2026 (shares of each period's total).
Source: U.S. Census Bureau, International Trade API: U.S. imports by HS code and country (calendar 2025; Jan to Aug 2026) (data months 2025-12, 2026-08)
- China59% · $11.7B
- Japan13% · $2.5B
- Korea, South12% · $2.3B
- Malaysia3% · $571.7M
- Poland2% · $399.3M
- Taiwan2% · $385.2M
- All other countries10% · $1.9B
| Country | U.S. imports, 2025 | Share of this chart |
|---|---|---|
| China | 59% · $11.7B | 59.3% |
| Japan | 13% · $2.5B | 12.7% |
| Korea, South | 12% · $2.3B | 11.5% |
| Malaysia | 3% · $571.7M | 2.9% |
| Poland | 2% · $399.3M | 2.0% |
| Taiwan | 2% · $385.2M | 2.0% |
| All other countries | 10% · $1.9B | 9.7% |
U.S. general imports (customs value) in calendar 2025 under HS 8507.60; countries beyond the top six are grouped. The code can include goods beyond this mineral. The Shift view compares each country's share of 2025 with its share of Jan to Aug 2026 (shares of each period's total).
Source: U.S. Census Bureau, International Trade API: U.S. imports by HS code and country (calendar 2025; Jan to Aug 2026) (data months 2025-12, 2026-08)
Price
Price, annual average-real, battery-grade lithium carbonate, dollars per metric ton
Source: U.S. Geological Survey, Mineral Commodity Summaries 2026: Lithium (February 2026)
Trade and tariffs
Tariff codes and the countries behind U.S. imports and exports.
Trade codes and tariffs
| HTS code | What it covers | Normal rate | Column 2 rate |
|---|---|---|---|
| 2825.20 | Lithium oxide and hydroxide | 3.7% | 25% |
| 2836.91 | Lithium carbonates | 3.7% | 25% |
| 8507.60 | Lithium-ion batteries | 3.4% | 40% |
Rates from the U.S. Harmonized Tariff Schedule (USITC, saved 2026-10-26). The normal rate is column 1 general; column 2 applies to countries without normal trade relations. A range means different products under the code have different rates. Section 232, Section 301, emergency tariffs and antidumping or countervailing duties are set in separate notices and are not shown. Look up any code at hts.usitc.gov. These are the main codes for this mineral, not a complete list.
Source: U.S. International Trade Commission, Harmonized Tariff Schedule of the United States, general and column 2 rates (edition current when saved)
U.S. trade by country
U.S. imports in 2025 by source country, code 8507.60
| Name | Value |
|---|---|
| China | 59% · $11.7B |
| Japan | 13% · $2.5B |
| Korea, South | 12% · $2.3B |
| Malaysia | 3% · $571.7M |
| Poland | 2% · $399.3M |
| Taiwan | 2% · $385.2M |
U.S. exports in 2025 by destination, code 8507.60
| Name | Value |
|---|---|
| Mexico | 38% · $1.6B |
| Canada | 22% · $938.8M |
| Australia | 7% · $305.1M |
| Netherlands | 4% · $187.8M |
| United Kingdom | 4% · $157.7M |
| Korea, South | 3% · $116.3M |
2825.20 Lithium oxide and hydroxide
Top import sources Chile 82%, Australia 11%, China 4%
Top export destinations Japan 87%, Argentina 3%, Germany 2%
2836.91 Lithium carbonates
Top import sources Argentina 56%, Chile 43%, France 1%
Top export destinations Germany 24%, Australia 21%, Canada 15%
8507.60 Lithium ion batteries
Top import sources China 59%, Japan 13%, Korea, South 12%
Top export destinations Mexico 38%, Canada 22%, Australia 7%
U.S. Census Bureau International Trade API, saved 2026-10-26. Imports are general imports (customs value) and exports are total exports, in U.S. dollars. Duty collected is Census's calculated duty on imports for consumption. Figures cover every 10-digit product under the code, so they can include goods beyond this mineral, and the duty shown is not split into Section 232, Section 301 or antidumping duties. Bars show the largest code for each direction. Group rows such as the EU or OECD are left out so no country is counted twice.
Source: U.S. Census Bureau, International Trade API: U.S. imports and exports by HS code and country (calendar 2025, and January to Aug 2026) (data months 2025-12, 2026-08)
Value chain and risk
Where in the chain the bottlenecks sit, and what other governments and sources say about supply risk.
Value chain: where the bottlenecks are
Mining
The only commercial-scale U.S. lithium production in 2025 was a brine operation in Nevada. (U.S. activity)
The source says
“Commercial-scale lithium production in the United States was from a continental brine operation in Nevada.”
Source: USGS Mineral Commodity Summaries 2026, Lithium (2026-02)
Ore processing and primary recovery
The only U.S. spodumene-concentrate plant mentioned (Kings Mountain, North Carolina) was still a proposal being considered for DOE grant funding, so no U.S. concentrate output is shown. (no U.S. activity)
The source says
“Through a grant awarded to Albemarle, DOE proposes to partially fund the design, construction, and start of operations for a mineral processing plant that would produce approximately 420,000 metric tons of spodumene concentrate annually.”
Source: U.S. Department of Energy, DOE/EA-2265: Kings Mountain Lithium Mine Project (2025)
Refining and separation bottleneck
EIA says Chinese companies held over two-thirds of world cobalt and lithium processing capacity in 2022. (U.S. role not stated)
The source says
“in 2022, Chinese companies accounted for over two-thirds of the world's cobalt and lithium processing capacity”
Source: EIA Today in Energy, China dominates global trade of battery minerals (2025-05-21)
Metal, alloy and chemical
Two U.S. companies make a range of downstream lithium compounds from domestic or imported carbonate, chloride and hydroxide; imports of lithium came from Chile (54%) and Argentina (43%) in 2021-24. (partly U.S.)
The source says
“Two companies produced a wide range of downstream lithium compounds in the United States from domestic or imported lithium carbonate, lithium chloride, and lithium hydroxide.”
“Import Sources (2021–24): Chile, 54%; Argentina, 43%; and other, 3%.”
Source: USGS Mineral Commodity Summaries 2026, Lithium (2026-02)
Components and end use
Batteries took an estimated 88% of global lithium use. (U.S. role not stated)
The source says
“global end uses were estimated as follows: batteries, 88%;”
Source: USGS Mineral Commodity Summaries 2026, Lithium (2026-02)
Recycling
Construction of lithium battery recycling plants continued through 2025. (partly U.S.)
The source says
“Construction of lithium battery recycling plants continued throughout 2025.”
Source: USGS Mineral Commodity Summaries 2026, Lithium (2026-02)
Pilot. Summaries are ours, from official pages; each quoted passage is checked against the saved page. “Bottleneck” (orange dot) is shown only where the quote shows one country dominating the stage or the United States relying on imports for it. “No sourced data yet” means we have not found a source, not that the stage is unproblematic.
Mines, plants and partners
Named facilities with their operators and locations, as each source describes them on the date shown. 6 sourced entries for Lithium.
Mining
Albemarle Corporation
near Silver Peak, Esmeralda County, Nevada, United States · Operating
The source says
“The Bureau of Land Management has approved expansion of the existing Silver Peak lithium mine near Silver Peak in Esmeralda County.”
“The mine has been in operation since 1965 and is currently the only producing lithium mine in the United States.”
“Albemarle Corporation will also construct two transfer pump stations and related pipelines, two weak brine ponds, and conduct future production well-drilling.”
Source: U.S. Bureau of Land Management, BLM approves Silver Peak lithium mine expansion (2026-02-27)
Albemarle Corporation
Kings Mountain, North Carolina, United States · Planned
The source says
“Located in Kings Mountain, North Carolina, this project aims to resume open pit mining and expand the footprint of a site that is one of the few known hard-rock lithium deposits in the U.S.”
“Project sponsor Albemarle expects”
Source: U.S. Permitting Council, Kings Mountain Lithium Material Processing Plant Project Completes Federal Permitting (2026-03-30)
Talison Lithium Pty Ltd (IGO/Tianqi joint venture 51%, Albemarle Corporation 49%)
Greenbushes, about 250 km south of Perth, Western Australia, Australia · Operating
The source says
“a 51% stake in the Talison Lithium Pty Ltd (Talison) Greenbushes Lithium Operation (49% owned by Albemarle Corporation)”
“Located approximately 250km south of Perth, Greenbushes is Western Australia’s longest continuously operated mining area.”
Source: IGO Limited, Lithium Joint Venture (2026)
Ore processing and primary recovery
Talison Lithium Pty Ltd (IGO/Tianqi joint venture 51%, Albemarle Corporation 49%)
Greenbushes, Western Australia, Australia · Status not stated
The source says
“CGP3 will have a processing capacity of 2.4 million tonnes per annum producing up to 500,000 tonnes per annum of lithium mineral concentrate.”
“Located approximately 250km south of Perth, Greenbushes”
Source: IGO Limited, Lithium Joint Venture (2026)
Refining and separation
Lithium Nevada Corp. (DOE loan applicant)
Humboldt County, Nevada, United States · Planned
The source says
“The DOE Loan Programs Office (LPO) is proposing to issue a loan to Lithium Nevada Corp. to advance Phase 1 of the Thacker Pass Project in Humboldt County, Nevada.”
“The subject of DOE loan is for the mine processing facilities and associated infrastructure, and not for the development and operation of the open pit mine.”
Source: U.S. Department of Energy, DOE/EIS-0561: Thacker Pass Lithium Mine Project (2024)
Tianqi Lithium Energy Australia (IGO/Tianqi joint venture, 100%)
Kwinana, about 35 km south of Perth, Western Australia, Australia · Status not stated
The source says
“100% ownership of the Kwinana Lithium Hydroxide Refinery.”
“Kwinana is approximately 35km south of Perth, Western Australia”
Source: IGO Limited, Lithium Joint Venture (2026)
A curated list, not a complete register: it shows facilities we could confirm in a source page, and a missing name means we have not sourced it, not that it does not exist. Each quoted passage is checked against the saved page. Partnerships are listed only where the source states them.
Policy and funding
Federal items we track for this mineral, each linked to its original.
Policy timeline
Tagged by AI from federal sources; each links to the original. How we label.
Source: U.S. federal sources (Federal Register, Grants.gov, DOE, Regulations.gov, DFC), Policy items tagged for Lithium (dates per item)
Federal awards already made
Cirba Solutions, LLC · Department of Energy · $200M obligated · started 2025-01-01
Source: usaspending.gov, retrieved 2026-10-29
American Battery Technology Company · Department of Energy · $147.6M obligated · started 2025-01-01
Source: usaspending.gov, retrieved 2026-10-29
Li Industries, Inc. · Department of Energy · $55.2M obligated · started 2025-01-01
Source: usaspending.gov, retrieved 2026-10-29
The Research Foundation for the State University of New York · National Science Foundation · $29.9M obligated · started 2024-03-01
Source: usaspending.gov, retrieved 2026-10-29
General Atomics · Department of Energy · $19.5M obligated · started 2026-09-29
Source: usaspending.gov, retrieved 2026-10-29
The 5 largest of 32 AI-tagged awards from USAspending (last 12 months, found by keyword; some are only loosely about this mineral). See all awards for Lithium.
Source: U.S. Department of the Treasury, Bureau of the Fiscal Service, USAspending.gov: spending by award (contracts and grants, last 12 months) (award start dates per item)
Data tables
The USGS figures behind the charts. Click a column heading to sort.
Lithium: USGS tables
United States
| Measure | Unit | 2024 | 2025 |
|---|---|---|---|
| Net import reliance as a percentage of apparent consumption | percent | >50 | >50 |
| Production | metric tons | W | W |
| Imports for consumption | metric tons | 3,020 | 3,800 |
| Exports | metric tons | 1,690 | 2,000 |
| Consumption, apparent | metric tons | W | W |
| Price, annual average-real, battery-grade lithium carbonate, dollars per metric ton | dollars per metric ton | 11,800 | 9,000 |
| Employment, mine and mill, number | number | 70 | 70 |
World production (metric tons; top 6 of 10, plus other countries)
| Country | 2024 | 2025 | Share |
|---|---|---|---|
| Australia | 82,700 | 92,000 | 32% |
| China | 41,400 | 62,000 | 21% |
| Chile | 48,900 | 56,000 | 19% |
| Zimbabwe | 20,000 | 28,000 | 10% |
| Argentina | 13,800 | 23,000 | 8% |
| Brazil | 10,200 | 12,000 | 4% |
| Other countries | — | — |
World total 2025: 290,000 metric tons (as printed by USGS, rounded).
World reserves (metric tons; top 6 of 10, plus other countries)
| Country | 2025 | Share |
|---|---|---|
| Chile | 9,200,000 | 25% |
| Australia | 8,400,000 | 23% |
| China | 4,600,000 | 12% |
| United States | 4,400,000 | 12% |
| Argentina | 4,400,000 | 12% |
| Canada | 1,600,000 | 4% |
| Other countries | 2,400,000 | 6% |
World total 2025: 37,000,000 metric tons (as printed by USGS, rounded).
U.S. import sources: All (percent of imports, 2021–24)
| Country | Share (%) |
|---|---|
| Chile | 54 |
| Argentina | 43 |
| Other countries | 3 |
Source: U.S. Geological Survey, Mineral Commodity Summaries 2026: Lithium (February 2026)