All fact sheets · The Strata Memo
Indium
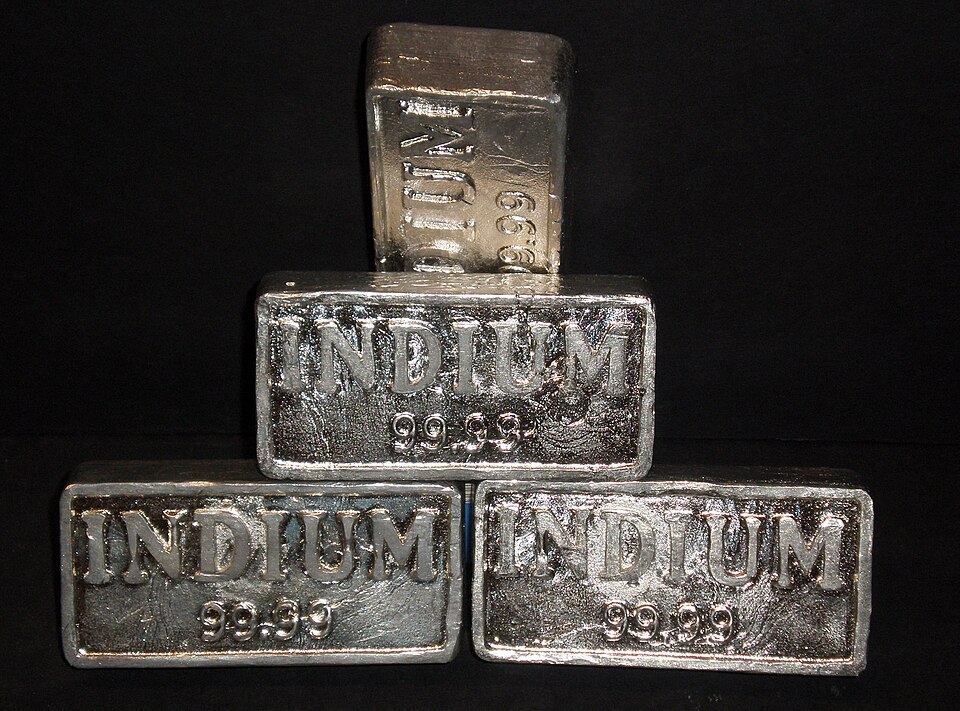

Hover, focus or tap to see the real thing
Photo Nerdtalker. “Indium.jpg.” CC BY-SA 3.0. Wikimedia Commons. File page
Chemical details
- State at room conditions
- Solid
- Melting point
- 430 K (157 °C)
- Boiling point
- 2,345 K (2,072 °C)
- Density
- 7.31 g/cm³
- Common oxidation states
- +3
- Electronegativity (Pauling)
- 1.78
- Atomic radius
- 193 pm
- First ionization energy
- 5.786 eV
- Discovered
- 1863
Source: U.S. National Library of Medicine, PubChem, Periodic Table of Elements (element Indium) (current at retrieval)
On the USGS 2025 List of Critical Minerals. Figures: USGS Mineral Commodity Summaries 2026 (data release, public domain). Estimates are USGS's; check the USGS chapter for notes. Each panel names its source; full citations are in the methodology source register.
Overview
The headline numbers: how much the U.S. depends on imports and how concentrated supply is.
How much does the U.S. import?
of U.S. indium use was met by imports in 2025 (USGS net import reliance).
Source: U.S. Geological Survey, Mineral Commodity Summaries 2026: Indium (February 2026)
Did you know?
Indium is named for the indigo-blue line in its spectrum.
Checked against two independent sources. Verified 2026-10-26.
Sources: Wikipedia · University of Waterloo Chemistry, Periodic Table Project (Wikipedia text is CC BY-SA)
How concentrated is supply?
91% of world production comes from three countries (China, Korea, Republic of, Japan). Highly concentrated.
Thirds of the bar: under 33%, 33 to 65%, 66% and over. Our own rule of thumb, not a USGS rating.
Source: U.S. Geological Survey, Mineral Commodity Summaries 2026: Indium (February 2026)
Supply
Who produces it, where the reserves are, where U.S. imports come from, and how U.S. supply has moved.
Who has it, and who digs it?
Where it is produced, 2025 (Refinery production)
| Name | Value |
|---|---|
| China | 69% |
| Korea, Republic of | 16% |
| Japan | 6% |
| Canada | 4% |
| France | 2% |
| Belgium | 2% |
Share of the world total as printed by USGS (rounded). Production and reserves are different things: reserves are what is economic to mine. Hover or focus a bar for its value, or switch to the table view.
Source: U.S. Geological Survey, Mineral Commodity Summaries 2026: Indium (February 2026)
Where U.S. imports come from
Choose a data set, then a view. A country keeps the same color in every chart on this page. Grey means other countries, or a country beyond the seven colors (always labeled). Hover or focus a mark for its value, or use the table view.
- Korea, Republic of25%
- Japan22%
- China12%
- Canada11%
- Other countries30%
| Country | Share of U.S. imports | Share of this chart |
|---|---|---|
| Korea, Republic of | 25% | 25.0% |
| Japan | 22% | 22.0% |
| China | 12% | 12.0% |
| Canada | 11% | 11.0% |
| Other countries | 30% | 30.0% |
Average share of U.S. imports of all forms, 2021–24, as printed by USGS (rounded, so shares may not sum to 100). Other countries are USGS's own grouping.
Source: U.S. Geological Survey, Mineral Commodity Summaries 2026: Indium (February 2026)
- Brazil31% · $64.3M
- Taiwan10% · $20.7M
- China9% · $18.5M
- Korea, South9% · $18.3M
- Canada8% · $16.9M
- Germany8% · $16.5M
- All other countries25% · $51.7M
| Country | U.S. imports, 2025 | Share of this chart |
|---|---|---|
| Brazil | 31% · $64.3M | 31.0% |
| Taiwan | 10% · $20.7M | 10.0% |
| China | 9% · $18.5M | 8.9% |
| Korea, South | 9% · $18.3M | 8.9% |
| Canada | 8% · $16.9M | 8.2% |
| Germany | 8% · $16.5M | 8.0% |
| All other countries | 25% · $51.7M | 25.0% |
U.S. general imports (customs value) in calendar 2025 under HS 8112.92; countries beyond the top six are grouped. The code can include goods beyond this mineral. The Shift view compares each country's share of 2025 with its share of Jan to Aug 2026 (shares of each period's total).
Source: U.S. Census Bureau, International Trade API: U.S. imports by HS code and country (calendar 2025; Jan to Aug 2026) (data months 2025-12, 2026-08)
Price
Price, annual average, dollars per kilogram: U.S. warehouse, free on board
Source: U.S. Geological Survey, Mineral Commodity Summaries 2026: Indium (February 2026)
Trade and tariffs
Tariff codes and the countries behind U.S. imports and exports.
Trade codes and tariffs
| HTS code | What it covers | Normal rate | Column 2 rate |
|---|---|---|---|
| 8112.92 | Beryllium, chromium, hafnium, rhenium, thallium, cadmium, germanium, vanadium, gallium, indium and niobium (columbium), and articles of these metals, including waste and scrap: Unwrought; waste and scrap; powders | Free to 4.9% * | Free to 45% |
Rates from the U.S. Harmonized Tariff Schedule (USITC, saved 2026-10-26). The normal rate is column 1 general; column 2 applies to countries without normal trade relations. A range means different products under the code have different rates. An asterisk means the schedule footnotes point to Chapter 99 additional-duty headings. Section 232, Section 301, emergency tariffs and antidumping or countervailing duties are set in separate notices and are not shown. Look up any code at hts.usitc.gov. These are the main codes for this mineral, not a complete list.
Source: U.S. International Trade Commission, Harmonized Tariff Schedule of the United States, general and column 2 rates (edition current when saved)
U.S. trade by country
U.S. imports in 2025 by source country, code 8112.92
| Name | Value |
|---|---|
| Brazil | 31% · $64.3M |
| Taiwan | 10% · $20.7M |
| China | 9% · $18.5M |
| Korea, South | 9% · $18.3M |
| Canada | 8% · $16.9M |
| Germany | 8% · $16.5M |
U.S. exports in 2025 by destination, code 8112.92
| Name | Value |
|---|---|
| Germany | 32% · $11.8M |
| Japan | 20% · $7.4M |
| Belgium | 12% · $4.3M |
| Taiwan | 11% · $4.1M |
| Canada | 7% · $2.4M |
| United Kingdom | 3% · $1.1M |
8112.92 Ga, hf, indium, niobium, rhenium & arti,wast/scrp
Top import sources Brazil 31%, Taiwan 10%, China 9%
Top export destinations Germany 32%, Japan 20%, Belgium 12%
U.S. Census Bureau International Trade API, saved 2026-10-26. Imports are general imports (customs value) and exports are total exports, in U.S. dollars. Duty collected is Census's calculated duty on imports for consumption. Figures cover every 10-digit product under the code, so they can include goods beyond this mineral, and the duty shown is not split into Section 232, Section 301 or antidumping duties. Bars show the largest code for each direction. Group rows such as the EU or OECD are left out so no country is counted twice.
Source: U.S. Census Bureau, International Trade API: U.S. imports and exports by HS code and country (calendar 2025, and January to Aug 2026) (data months 2025-12, 2026-08)
Value chain and risk
Where in the chain the bottlenecks sit, and what other governments and sources say about supply risk.
Value chain: where the bottlenecks are
Mining
Indium is recovered mostly from the zinc ore mineral sphalerite, where it occurs at under 1 to 100 parts per million, and none was recovered from U.S. ores in 2025. (no U.S. activity)
The source says
“Indium is most commonly recovered from the zinc-sulfide ore mineral sphalerite.”
“The indium content of zinc deposits from which it is recovered ranges from less than 1 part per million to 100 parts per million.”
“Indium was not recovered from ores in the United States in 2025.”
Source: USGS Mineral Commodity Summaries 2026, Indium (PDF page 102) (2026-02)
Ore processing and primary recovery
Indium was not recovered from ores in the United States in 2025; it is mostly recovered from the zinc ore mineral sphalerite. (no U.S. activity)
The source says
“Indium was not recovered from ores in the United States in 2025.”
“Indium is most commonly recovered from the zinc-sulfide ore mineral sphalerite.”
Source: USGS Mineral Commodity Summaries 2026, Indium (PDF page 102) (2026-02)
Refining and separation bottleneck
China accounts for 70% of world indium production, and in February 2025 China put indium under new export restrictions; exports of unwrought indium fell 72% year over year to September 2025. (no U.S. activity)
The source says
“China is the leading global producer of indium, accounting for 70% of the world total.”
“In February 2025, China’s Ministry of Commerce subjected several critical minerals, including indium, to new export restrictions.”
“Asian Metal reported that exports of unwrought indium declined by 72%, year over year, from September 2024 to September 2025.”
Source: USGS Mineral Commodity Summaries 2026, Indium (PDF page 102) (2026-02)
Metal, alloy and chemical
Several U.S. companies make indium alloys, compounds, high-purity metal and solders from imported indium metal; imports came from South Korea (25%), Japan (22%) and China (12%) in 2021-24. (partly U.S.)
The source says
“Several companies produced indium products—including alloys, compounds, high-purity metal, and solders—from imported indium metal.”
“Republic of Korea, 25%; Japan 22%; China,6 12%; Canada, 11%; and other, 30%.”
Source: USGS Mineral Commodity Summaries 2026, Indium (PDF page 102) (2026-02)
Components and end use
Indium tin oxide production accounts for most global indium consumption. (U.S. role not stated)
The source says
“Production of indium tin oxide (ITO) continued to account for most global indium consumption.”
Source: USGS Mineral Commodity Summaries 2026, Indium (PDF page 102) (2026-02)
Recycling
Indium is most commonly recovered from ITO scrap in Japan and South Korea; scrap is recycled in the United States but the quantity is not available. (partly U.S.)
The source says
“Indium is most commonly recovered from ITO scrap in Japan and the Republic of Korea.”
“data on the quantity of indium recovered from scrap were not available.”
Source: USGS Mineral Commodity Summaries 2026, Indium (PDF page 102) (2026-02)
Pilot. Summaries are ours, from official pages; each quoted passage is checked against the saved page. “Bottleneck” (orange dot) is shown only where the quote shows one country dominating the stage or the United States relying on imports for it. “No sourced data yet” means we have not found a source, not that the stage is unproblematic.
Mines, plants and partners
Named facilities with their operators and locations, as each source describes them on the date shown. 3 sourced entries for Indium.
Refining and separation
Crucible Metals, LLC (a subsidiary of Korea Zinc)
Clarksville, Tennessee, United States · Planned
The source says
“awarded $210 million in direct funding under the CHIPS and Science Act to a subsidiary of Korea Zinc — Crucible Metals, LLC — to support an advanced smelter and critical minerals processing facility in Tennessee”
“the following critical and strategic minerals: gallium, bismuth, germanium, indium, antimony, tellurium, cadmium”
“The planned U.S. facility in Clarksville, Tennessee will be an advanced replica of the Onsan facility and is expected to be operational by 2029.”
Source: U.S. Department of Commerce NIST, Department of Commerce Awards CHIPS Incentives to a Subsidiary of Korea Zinc (Crucible Metals) (2025-12-15)
Korea Zinc
Onsan, Ulsan, South Korea · Operating
The source says
“Korea Zinc is a global leader in mineral production and operates the world’s largest non-ferrous smelter in Onsan, Korea.”
“The Onsan facility produces over one million tons of minerals per year and is the largest single-site producer in the world of zinc, lead, silver, and indium.”
Source: U.S. Department of Commerce NIST, Department of Commerce Awards CHIPS Incentives to a Subsidiary of Korea Zinc (Crucible Metals) (2025-12-15)
Teck Resources Ltd.
Trail, British Columbia, Canada · Operating
The source says
“germanium, gallium, and antimony production capacity at Teck Resources Ltd.'s Trail Operations – a smelting and refining complex in southern British Columbia that produces zinc, lead, silver, indium, germanium, gallium, and other critical materials.”
“Much of Trail's germanium-bearing feed has historically come from concentrates delivered from Teck's Red Dog mine in Alaska.”
Source: Metal Tech News, Trail anchors Canada's critical minerals push (2026-07-08)
A curated list, not a complete register: it shows facilities we could confirm in a source page, and a missing name means we have not sourced it, not that it does not exist. Each quoted passage is checked against the saved page. Partnerships are listed only where the source states them.
Policy and funding
Federal items we track for this mineral, each linked to its original.
Federal awards already made
Alaska Department of Natural Resources · Department of the Interior · $1.6M obligated · started 2026-03-01
Source: usaspending.gov, retrieved 2026-10-29
University of Kentucky Research Foundation, The · Department of the Interior · $50.4K obligated · started 2023-08-01
Source: usaspending.gov, retrieved 2026-10-29
The 2 largest of 2 AI-tagged awards from USAspending (last 12 months, found by keyword; some are only loosely about this mineral). See all awards for Indium.
Source: U.S. Department of the Treasury, Bureau of the Fiscal Service, USAspending.gov: spending by award (contracts and grants, last 12 months) (award start dates per item)
Data tables
The USGS figures behind the charts. Click a column heading to sort.
Indium: USGS tables
United States
| Measure | Unit | 2024 | 2025 |
|---|---|---|---|
| Net import reliance as a percentage of estimated consumption | percent | 100 | 100 |
| Production, refinery | metric tons | — | — |
| Imports for consumption | metric tons | 220 | 220 |
| Exports | metric tons | NA | NA |
| Consumption, estimated | metric tons | 220 | 220 |
| Price, annual average, dollars per kilogram: U.S. warehouse, free on board | dollars per kilogram | 351 | 370 |
| Price, annual average, dollars per kilogram: Rotterdam, duties unpaid | dollars per kilogram | 311 | 380 |
World production: Refinery production (metric tons; top 6 of 9, plus other countries)
| Country | 2024 | 2025 | Share |
|---|---|---|---|
| China | 760 | 760 | 69% |
| Korea, Republic of | 180 | 180 | 16% |
| Japan | 65 | 65 | 6% |
| Canada | 40 | 40 | 4% |
| France | 21 | 21 | 2% |
| Belgium | 19 | 19 | 2% |
World total 2025: 1,100 metric tons (as printed by USGS, rounded).
U.S. import sources: All (percent of imports, 2021–24)
| Country | Share (%) |
|---|---|
| Korea, Republic of | 25 |
| Japan | 22 |
| China | 12 |
| Canada | 11 |
| Other countries | 30 |
Source: U.S. Geological Survey, Mineral Commodity Summaries 2026: Indium (February 2026)