All fact sheets · The Strata Memo
Gallium
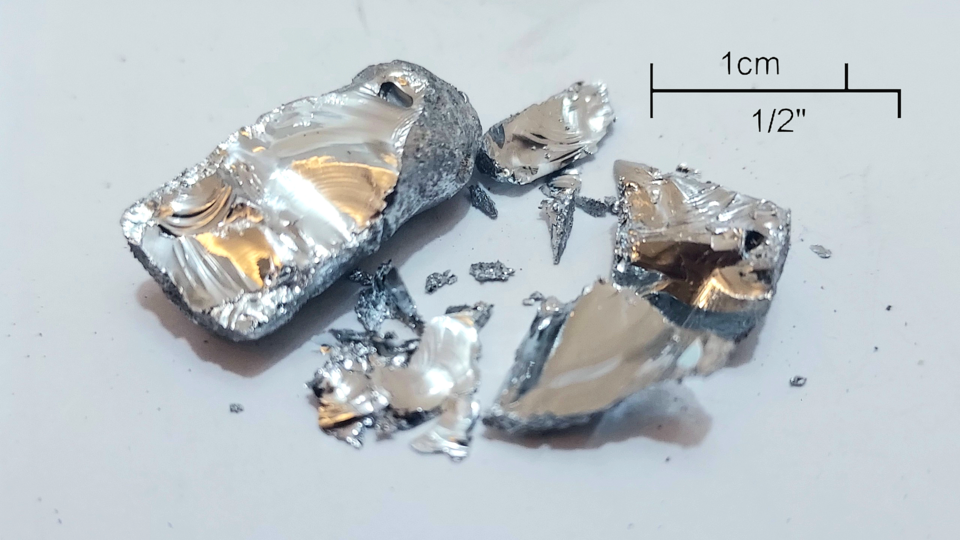

Hover, focus or tap to see the real thing
Photo Arònel123. “Gallium bar cracked open to show crystal structure with scale 1.png.” CC BY 4.0. Wikimedia Commons. File page
Chemical details
- State at room conditions
- Solid
- Melting point
- 303 K (30 °C)
- Boiling point
- 2,477 K (2,204 °C)
- Density
- 5.91 g/cm³
- Common oxidation states
- +3
- Electronegativity (Pauling)
- 1.81
- Atomic radius
- 187 pm
- First ionization energy
- 5.999 eV
- Discovered
- 1875
Source: U.S. National Library of Medicine, PubChem, Periodic Table of Elements (element Gallium) (current at retrieval)
On the USGS 2025 List of Critical Minerals. Figures: USGS Mineral Commodity Summaries 2026 (data release, public domain). Estimates are USGS's; check the USGS chapter for notes. Each panel names its source; full citations are in the methodology source register.
Overview
The headline numbers: how much the U.S. depends on imports and how concentrated supply is.
How much does the U.S. import?
of U.S. gallium use was met by imports in 2025 (USGS net import reliance).
Source: U.S. Geological Survey, Mineral Commodity Summaries 2026: Gallium (February 2026)
Did you know?
Gallium melts at normal body temperature, so a lump will melt in your hand.
Checked against two independent sources. Verified 2026-10-26.
Sources: Wikipedia · Los Alamos National Laboratory periodic table (Wikipedia text is CC BY-SA)
How concentrated is supply?
101% of world production comes from three countries (China, Russia, Japan). Highly concentrated.
Thirds of the bar: under 33%, 33 to 65%, 66% and over. Our own rule of thumb, not a USGS rating.
Source: U.S. Geological Survey, Mineral Commodity Summaries 2026: Gallium (February 2026)
Supply
Who produces it, where the reserves are, where U.S. imports come from, and how U.S. supply has moved.
Who has it, and who digs it?
Where it is produced, 2025 (Primary production)
| Name | Value |
|---|---|
| China | 100% |
| Russia | 1% |
| Japan | 0% |
Share of the world total as printed by USGS (rounded). Production and reserves are different things: reserves are what is economic to mine. Hover or focus a bar for its value, or switch to the table view.
Source: U.S. Geological Survey, Mineral Commodity Summaries 2026: Gallium (February 2026)
Where U.S. imports come from
Choose a data set, then a view. A country keeps the same color in every chart on this page. Grey means other countries, or a country beyond the seven colors (always labeled). Hover or focus a mark for its value, or use the table view.
- Canada28%
- Japan22%
- China18%
- Germany16%
- Other countries16%
| Country | Share of U.S. imports | Share of this chart |
|---|---|---|
| Canada | 28% | 28.0% |
| Japan | 22% | 22.0% |
| China | 18% | 18.0% |
| Germany | 16% | 16.0% |
| Other countries | 16% | 16.0% |
Average share of U.S. imports of metal, 2021–24, as printed by USGS (rounded, so shares may not sum to 100). Other countries are USGS's own grouping.
Source: U.S. Geological Survey, Mineral Commodity Summaries 2026: Gallium (February 2026)
- Brazil31% · $64.3M
- Taiwan10% · $20.7M
- China9% · $18.5M
- Korea, South9% · $18.3M
- Canada8% · $16.9M
- Germany8% · $16.5M
- All other countries25% · $51.7M
| Country | U.S. imports, 2025 | Share of this chart |
|---|---|---|
| Brazil | 31% · $64.3M | 31.0% |
| Taiwan | 10% · $20.7M | 10.0% |
| China | 9% · $18.5M | 8.9% |
| Korea, South | 9% · $18.3M | 8.9% |
| Canada | 8% · $16.9M | 8.2% |
| Germany | 8% · $16.5M | 8.0% |
| All other countries | 25% · $51.7M | 25.0% |
U.S. general imports (customs value) in calendar 2025 under HS 8112.92; countries beyond the top six are grouped. The code can include goods beyond this mineral. The Shift view compares each country's share of 2025 with its share of Jan to Aug 2026 (shares of each period's total).
Source: U.S. Census Bureau, International Trade API: U.S. imports by HS code and country (calendar 2025; Jan to Aug 2026) (data months 2025-12, 2026-08)
Price
Price, average unit value of imports, dollars per kilogram
Source: U.S. Geological Survey, Mineral Commodity Summaries 2026: Gallium (February 2026)
Trade and tariffs
Tariff codes and the countries behind U.S. imports and exports.
Trade codes and tariffs
| HTS code | What it covers | Normal rate | Column 2 rate |
|---|---|---|---|
| 8112.92 | Beryllium, chromium, hafnium, rhenium, thallium, cadmium, germanium, vanadium, gallium, indium and niobium (columbium), and articles of these metals, including waste and scrap: Unwrought; waste and scrap; powders | Free to 4.9% * | Free to 45% |
Rates from the U.S. Harmonized Tariff Schedule (USITC, saved 2026-10-26). The normal rate is column 1 general; column 2 applies to countries without normal trade relations. A range means different products under the code have different rates. An asterisk means the schedule footnotes point to Chapter 99 additional-duty headings. Section 232, Section 301, emergency tariffs and antidumping or countervailing duties are set in separate notices and are not shown. Look up any code at hts.usitc.gov. These are the main codes for this mineral, not a complete list.
Source: U.S. International Trade Commission, Harmonized Tariff Schedule of the United States, general and column 2 rates (edition current when saved)
U.S. trade by country
U.S. imports in 2025 by source country, code 8112.92
| Name | Value |
|---|---|
| Brazil | 31% · $64.3M |
| Taiwan | 10% · $20.7M |
| China | 9% · $18.5M |
| Korea, South | 9% · $18.3M |
| Canada | 8% · $16.9M |
| Germany | 8% · $16.5M |
U.S. exports in 2025 by destination, code 8112.92
| Name | Value |
|---|---|
| Germany | 32% · $11.8M |
| Japan | 20% · $7.4M |
| Belgium | 12% · $4.3M |
| Taiwan | 11% · $4.1M |
| Canada | 7% · $2.4M |
| United Kingdom | 3% · $1.1M |
8112.92 Ga, hf, indium, niobium, rhenium & arti,wast/scrp
Top import sources Brazil 31%, Taiwan 10%, China 9%
Top export destinations Germany 32%, Japan 20%, Belgium 12%
U.S. Census Bureau International Trade API, saved 2026-10-26. Imports are general imports (customs value) and exports are total exports, in U.S. dollars. Duty collected is Census's calculated duty on imports for consumption. Figures cover every 10-digit product under the code, so they can include goods beyond this mineral, and the duty shown is not split into Section 232, Section 301 or antidumping duties. Bars show the largest code for each direction. Group rows such as the EU or OECD are left out so no country is counted twice.
Source: U.S. Census Bureau, International Trade API: U.S. imports and exports by HS code and country (calendar 2025, and January to Aug 2026) (data months 2025-12, 2026-08)
Value chain and risk
Where in the chain the bottlenecks sit, and what other governments and sources say about supply risk.
Value chain: where the bottlenecks are
Mining
Gallium has no mine of its own: it is recovered as a byproduct of making alumina from bauxite or, less often, of zinc processing. (no U.S. activity)
The source says
“Globally, primary gallium is recovered predominantly as a byproduct of processing bauxite ores.”
“Gallium may also be recovered as a byproduct of processing zinc ores.”
Source: USGS Mineral Commodity Summaries 2026, Gallium (2026-02)
Middle Tennessee zinc mines have been suspended since November 2023; drilling during the closure defined more zinc, germanium and gallium resources. (partly U.S.)
The source says
“Operations at the Middle Tennessee zinc mines have been suspended since November 2023.”
“During the closure, drilling work was conducted to define additional zinc, germanium, and gallium resources.”
Source: USGS Mineral Commodity Summaries 2026, Zinc (PDF page 216) (2026-02)
Ore processing and primary recovery bottleneck
No primary gallium has been recovered in the United States since 1987, and China made 99% of the world's primary low-purity gallium in 2025. (no U.S. activity)
The source says
“No domestic primary (low-purity, unrefined) gallium has been recovered since 1987.”
“China accounted for 99% of worldwide primary low-purity gallium production.”
Source: USGS Mineral Commodity Summaries 2026, Gallium (2026-02)
Refining and separation bottleneck
One New York company refines high-purity gallium, but from imported low-purity metal and new scrap, so U.S. refining depends on imported feedstock. (partly U.S.)
The source says
“One company in New York recovered and refined high-purity gallium from imported primary low-purity gallium metal and new scrap.”
Source: USGS Mineral Commodity Summaries 2026, Gallium (2026-02)
Metal, alloy and chemical
Gallium arsenide and gallium nitride wafers are made in the United States, and imports of metal and wafers supply the rest of U.S. use. (partly U.S.)
The source says
“Imports of gallium metal, GaAs wafers, and domestic production of GaAs and GaN wafers continued to account for all U.S. consumption of gallium.”
Source: USGS Mineral Commodity Summaries 2026, Gallium (2026-02)
Components and end use
Most U.S. gallium goes into integrated circuits (73%) and optoelectronic devices (26%), including defense and telecommunications uses. (partly U.S.)
The source says
“ICs accounted for 73% of domestic gallium consumption, and optoelectronic devices accounted for 26%.”
Source: USGS Mineral Commodity Summaries 2026, Gallium (2026-02)
Recycling
There is no old-scrap recycling, but scrap from making GaAs devices is reprocessed at one New York facility. (partly U.S.)
The source says
“Old scrap, none. Substantial quantities of new scrap generated in the manufacture of GaAs-based devices were reprocessed to recover high-purity gallium at one facility in New York.”
Source: USGS Mineral Commodity Summaries 2026, Gallium (2026-02)
Pilot. Summaries are ours, from official pages; each quoted passage is checked against the saved page. “Bottleneck” (orange dot) is shown only where the quote shows one country dominating the stage or the United States relying on imports for it. “No sourced data yet” means we have not found a source, not that the stage is unproblematic.
Mines, plants and partners
Named facilities with their operators and locations, as each source describes them on the date shown. 3 sourced entries for Gallium.
Ore processing and primary recovery
Alcoa
Wagerup, Western Australia, Australia · Under construction
The source says
“A major critical minerals project in Western Australia will get underway with Australia Japan and the United States backing construction of a new gallium production facility at Alcoa’s Wagerup alumina refinery.”
“The facility will be constructed and operated by Alcoa, building on its long-standing expertise in alumina refining and existing operations at Wagerup, in Western Australia.”
“Production capacity is anticipated to be 100 tonnes per annum, representing about 10 per cent of global demand for gallium.”
Source: Export Finance Australia, Albanese Government supports Wagerup critical mineral project (2026-07-15)
Rio Tinto
Saguenay-Lac-Saint-Jean, Quebec, Canada · Planned
The source says
“Rio Tinto and its new partner Indium Corporation have successfully extracted the first primary gallium”
“the bauxite processed in Rio Tinto’s Vaudreuil alumina refinery in Quebec, the only one in Canada”
“If successful, Rio Tinto plans to build a demonstration plant in Saguenay-Lac-Saint-Jean, financially supported by the government of Quebec, with a capacity of up to 3.5 tonnes of gallium per year.”
Source: Rio Tinto, Rio Tinto extracts first gallium from its alumina refining process with partner Indium Corporation (2025-05-07)
Refining and separation
Crucible Metals, LLC (a subsidiary of Korea Zinc)
Clarksville, Tennessee, United States · Planned
The source says
“awarded $210 million in direct funding under the CHIPS and Science Act to a subsidiary of Korea Zinc — Crucible Metals, LLC — to support an advanced smelter and critical minerals processing facility in Tennessee”
“the following critical and strategic minerals: gallium, bismuth, germanium, indium, antimony, tellurium, cadmium”
“The planned U.S. facility in Clarksville, Tennessee will be an advanced replica of the Onsan facility and is expected to be operational by 2029.”
Source: U.S. Department of Commerce NIST, Department of Commerce Awards CHIPS Incentives to a Subsidiary of Korea Zinc (Crucible Metals) (2025-12-15)
A curated list, not a complete register: it shows facilities we could confirm in a source page, and a missing name means we have not sourced it, not that it does not exist. Each quoted passage is checked against the saved page. Partnerships are listed only where the source states them.
Geopolitics and supply risk
Export controls by other countries
China limited gallium exports from August 2023, banned them to the United States in December 2024, and lifted that ban for one year in November 2025.
The source says
“In November 2025, China lifted its ban on gallium exports to the United States for 1 year.”
“This followed the Government of China's gallium export controls implemented in August 2023 and China's ban of all gallium exports to the United States in December 2024.”
Source: USGS Mineral Commodity Summaries 2026, Gallium (2026-02)
Who supplies it
China made almost all of the world's primary low-purity gallium in 2025.
The source says
“China accounted for 99% of worldwide primary low-purity gallium production.”
Source: USGS Mineral Commodity Summaries 2026, Gallium (2026-02)
U.S. policy and funding
In 2025 the Energy Department announced up to $6 million for U.S. gallium research, and the Defense Production Act Title III funded a $29.9 million demonstration plant in Louisiana to recover gallium and scandium.
The source says
“In September, the U.S. Department of Energy announced as much as $6 million in funding for domestic research and development projects to help establish a domestic supply chain for gallium.”
“granted a $29.9 million award to a U.S. company to develop a demonstration facility in Louisiana that will recover gallium and scandium from industrial waste”
Source: USGS Mineral Commodity Summaries 2026, Gallium (2026-02)
Summaries are ours, from official pages. Each quoted passage is checked against the saved source page. This is a curated list for the edition shown, not a complete or current record of every measure.
Policy and funding
Federal items we track for this mineral, each linked to its original.
Federal awards already made
Carbide Radio Inc · National Science Foundation · $1.2M obligated · started 2026-08-15
Source: usaspending.gov, retrieved 2026-10-29
University of Kentucky Research Foundation, The · Department of the Interior · $50.4K obligated · started 2023-08-01
Source: usaspending.gov, retrieved 2026-10-29
The 2 largest of 2 AI-tagged awards from USAspending (last 12 months, found by keyword; some are only loosely about this mineral). See all awards for Gallium.
Source: U.S. Department of the Treasury, Bureau of the Fiscal Service, USAspending.gov: spending by award (contracts and grants, last 12 months) (award start dates per item)
Data tables
The USGS figures behind the charts. Click a column heading to sort.
Gallium: USGS tables
United States
| Measure | Unit | 2024 | 2025 |
|---|---|---|---|
| Net import reliance as a percentage of reported consumption | percent | 100 | 100 |
| Production, primary | kilograms | — | — |
| Imports for consumption: Metal | kilograms | 11,000 | 25,000 |
| Imports for consumption: Gallium arsenide wafers (gross weight) | kilograms | 152,000 | 110,000 |
| Exports | kilograms | NA | NA |
| Consumption, reported | kilograms | 18,700 | 19,000 |
| Price, average unit value of imports, dollars per kilogram | dollars per kilogram | 439 | 580 |
| Stocks, consumer, yearend | kilograms | 3,410 | 3,400 |
World production: Primary production (kilograms; top 6 of 4, plus other countries)
| Country | 2024 | 2025 | Share |
|---|---|---|---|
| China | 839,000 | 900,000 | 100% |
| Russia | 6,000 | 6,000 | 1% |
| Japan | 3,000 | 3,000 | 0% |
| United States | — | — | |
| Other countries | — | — |
World total 2025: 900,000 kilograms (as printed by USGS, rounded).
U.S. import sources: Metal (percent of imports, 2021–24)
| Country | Share (%) |
|---|---|
| Canada | 28 |
| Japan | 22 |
| China | 18 |
| Germany | 16 |
| Other countries | 16 |
Source: U.S. Geological Survey, Mineral Commodity Summaries 2026: Gallium (February 2026)