All fact sheets · The Strata Memo
Fluorspar
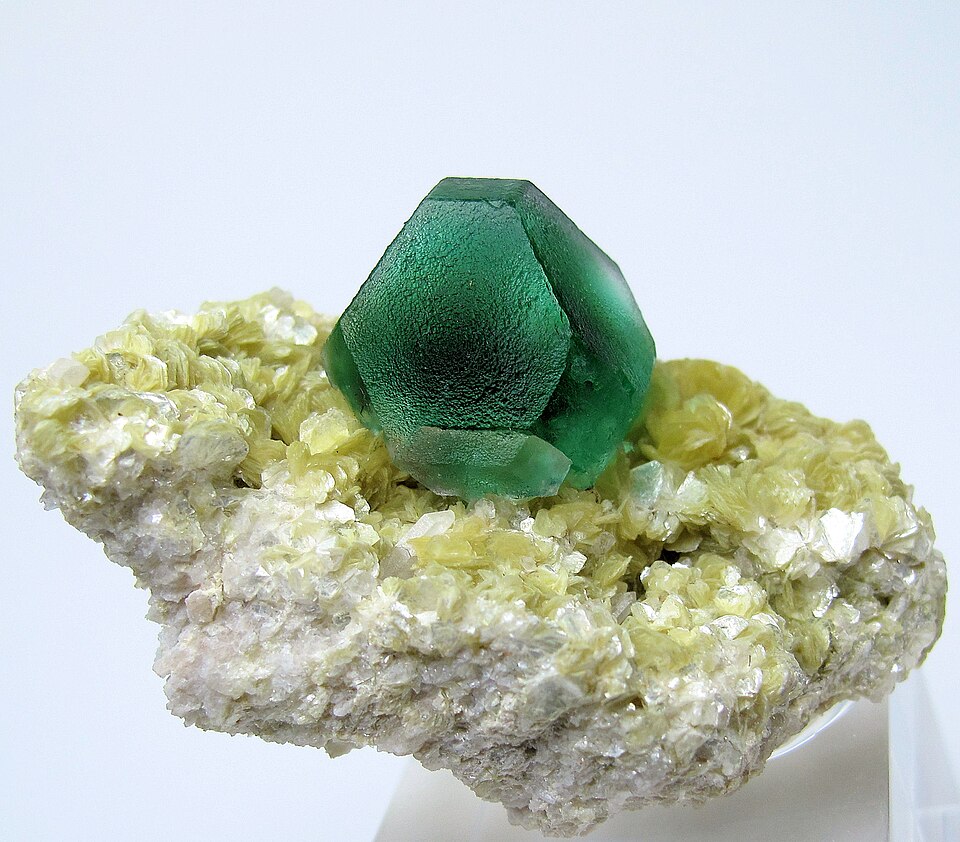

Hover, focus or tap to see the real thing
Photo CarlesMillan. “3192M-fluorite1.jpg.” CC BY-SA 3.0. Wikimedia Commons. File page
What it is
Calcium fluoride.
“the mineral form of calcium fluoride, CaF2”
Source: Wikipedia contributors, Fluorite (composition line) (text as saved)
On the USGS 2025 List of Critical Minerals. Figures: USGS Mineral Commodity Summaries 2026 (data release, public domain). Estimates are USGS's; check the USGS chapter for notes. Each panel names its source; full citations are in the methodology source register.
Overview
The headline numbers: how much the U.S. depends on imports and how concentrated supply is.
How much does the U.S. import?
of U.S. fluorspar use was met by imports in 2025 (USGS net import reliance).
Source: U.S. Geological Survey, Mineral Commodity Summaries 2026: Fluorspar (February 2026)
Did you know?
Fluorite gave its name to fluorescence: in 1852 George Stokes saw it glow blue under light and named the phenomenon after the mineral.
Checked against two independent sources. Verified 2026-10-26.
Sources: Wikipedia · Geology.com (Hobart King) (Wikipedia text is CC BY-SA)
How concentrated is supply?
90% of world production comes from three countries (China, Mexico, Mongolia). Highly concentrated.
Thirds of the bar: under 33%, 33 to 65%, 66% and over. Our own rule of thumb, not a USGS rating.
Source: U.S. Geological Survey, Mineral Commodity Summaries 2026: Fluorspar (February 2026)
Supply
Who produces it, where the reserves are, where U.S. imports come from, and how U.S. supply has moved.
Who has it, and who digs it?
Where it is produced, 2025
| Name | Value |
|---|---|
| China | 60% |
| Mexico | 15% |
| Mongolia | 15% |
| South Africa | 4% |
| Vietnam | 2% |
| Spain | 1% |
Where the reserves are
| Name | Value |
|---|---|
| China | 33% |
| Mexico | 21% |
| South Africa | 12% |
| Mongolia | 10% |
| Vietnam | 5% |
| Spain | 5% |
Share of the world total as printed by USGS (rounded). Production and reserves are different things: reserves are what is economic to mine. Hover or focus a bar for its value, or switch to the table view.
Source: U.S. Geological Survey, Mineral Commodity Summaries 2026: Fluorspar (February 2026)
Where U.S. imports come from
Choose a data set, then a view. A country keeps the same color in every chart on this page. Grey means other countries, or a country beyond the seven colors (always labeled). Hover or focus a mark for its value, or use the table view.
- Mexico64%
- Vietnam12%
- China10%
- South Africa9%
- Other countries5%
| Country | Share of U.S. imports | Share of this chart |
|---|---|---|
| Mexico | 64% | 64.0% |
| Vietnam | 12% | 12.0% |
| China | 10% | 10.0% |
| South Africa | 9% | 9.0% |
| Other countries | 5% | 5.0% |
Average share of U.S. imports of all forms, 2021–24, as printed by USGS (rounded, so shares may not sum to 100). Other countries are USGS's own grouping.
Source: U.S. Geological Survey, Mineral Commodity Summaries 2026: Fluorspar (February 2026)
- China54% · $4.3M
- Mexico22% · $1.8M
- Mongolia14% · $1.1M
- Pakistan9% · $732K
- Thailand0% · $31K
- Namibia0% · $16K
| Country | U.S. imports, 2025 | Share of this chart |
|---|---|---|
| China | 54% · $4.3M | 53.5% |
| Mexico | 22% · $1.8M | 22.3% |
| Mongolia | 14% · $1.1M | 14.4% |
| Pakistan | 9% · $732K | 9.2% |
| Thailand | 0% · $31K | 0.4% |
| Namibia | 0% · $16K | 0.2% |
U.S. general imports (customs value) in calendar 2025 under HS 2529.21; countries beyond the top six are grouped. The code can include goods beyond this mineral. The Shift view compares each country's share of 2025 with its share of Jan to Aug 2026 (shares of each period's total).
Source: U.S. Census Bureau, International Trade API: U.S. imports by HS code and country (calendar 2025; Jan to Aug 2026) (data months 2025-12, 2026-08)
- Mexico76% · $128.4M
- South Africa15% · $24.9M
- Mongolia3% · $4.6M
- Thailand3% · $4.5M
- Canada2% · $4.2M
- China2% · $2.9M
| Country | U.S. imports, 2025 | Share of this chart |
|---|---|---|
| Mexico | 76% · $128.4M | 75.8% |
| South Africa | 15% · $24.9M | 14.7% |
| Mongolia | 3% · $4.6M | 2.7% |
| Thailand | 3% · $4.5M | 2.6% |
| Canada | 2% · $4.2M | 2.5% |
| China | 2% · $2.9M | 1.7% |
U.S. general imports (customs value) in calendar 2025 under HS 2529.22; countries beyond the top six are grouped. The code can include goods beyond this mineral. The Shift view compares each country's share of 2025 with its share of Jan to Aug 2026 (shares of each period's total).
Source: U.S. Census Bureau, International Trade API: U.S. imports by HS code and country (calendar 2025; Jan to Aug 2026) (data months 2025-12, 2026-08)
Price
Price, average unit value of imports, cost, insurance, and freight, dollars per metric ton: Acid grade
Source: U.S. Geological Survey, Mineral Commodity Summaries 2026: Fluorspar (February 2026)
Trade and tariffs
Tariff codes and the countries behind U.S. imports and exports.
Trade codes and tariffs
| HTS code | What it covers | Normal rate | Column 2 rate |
|---|---|---|---|
| 2529.21 | Fluorspar: Containing by weight 97 percent or less of calcium fluoride | Free | 13.5% |
| 2529.22 | Fluorspar: Containing by weight more than 97 percent of calcium fluoride | Free | $5.51/t |
Rates from the U.S. Harmonized Tariff Schedule (USITC, saved 2026-10-26). The normal rate is column 1 general; column 2 applies to countries without normal trade relations. A range means different products under the code have different rates. Section 232, Section 301, emergency tariffs and antidumping or countervailing duties are set in separate notices and are not shown. Look up any code at hts.usitc.gov. These are the main codes for this mineral, not a complete list.
Source: U.S. International Trade Commission, Harmonized Tariff Schedule of the United States, general and column 2 rates (edition current when saved)
U.S. trade by country
U.S. imports in 2025 by source country, code 2529.22
| Name | Value |
|---|---|
| Mexico | 76% · $128.4M |
| South Africa | 15% · $24.9M |
| Mongolia | 3% · $4.6M |
| Thailand | 3% · $4.5M |
| Canada | 2% · $4.2M |
| China | 2% · $2.9M |
U.S. exports in 2025 by destination, code 2529.21
| Name | Value |
|---|---|
| Canada | 90% · $1.8M |
| South Africa | 5% · $93K |
| Mexico | 4% · $76K |
| Nicaragua | 1% · $13K |
| Taiwan | 0% · $9K |
| Peru | 0% · $9K |
2529.21 Fluorspar contng by wght 97% or under calcm fluord
Top import sources China 54%, Mexico 22%, Mongolia 14%
Top export destinations Canada 90%, South Africa 5%, Mexico 4%
2529.22 Fluorspar ov 97% of calcium fluord by wght
Top import sources Mexico 76%, South Africa 15%, Mongolia 3%
Top export destinations Canada 92%, Hong Kong 4%, Mexico 3%
U.S. Census Bureau International Trade API, saved 2026-10-26. Imports are general imports (customs value) and exports are total exports, in U.S. dollars. Duty collected is Census's calculated duty on imports for consumption. Figures cover every 10-digit product under the code, so they can include goods beyond this mineral, and the duty shown is not split into Section 232, Section 301 or antidumping duties. Bars show the largest code for each direction. Group rows such as the EU or OECD are left out so no country is counted twice.
Source: U.S. Census Bureau, International Trade API: U.S. imports and exports by HS code and country (calendar 2025, and January to Aug 2026) (data months 2025-12, 2026-08)
Value chain and risk
Where in the chain the bottlenecks sit, and what other governments and sources say about supply risk.
Value chain: where the bottlenecks are
Mining bottleneck
No significant U.S. fluorspar mining has been reported since 1995; excluding stockpile sales the United States was 100% net import reliant, and a Utah mine and processing plant was under construction. (no U.S. activity)
The source says
“Significant U.S. fluorspar (calcium fluoride, CaF2) mine production has not been reported since 1995.”
“Excluding sales from stockpiled fluorspar, the United States was 100% net import reliant for fluorspar.”
“A second company continued construction of a fluorspar mine and lumps-processing plant in Utah, with completion anticipated by yearend.”
Source: USGS Mineral Commodity Summaries 2026, Fluorspar (PDF page 84) (2026-02)
Ore processing and primary recovery
No sourced data yet.
Refining and separation
No sourced data yet.
Metal, alloy and chemical
Fluorspar is turned into anhydrous hydrogen fluoride in Louisiana and Texas, and the Department of Energy sells aqueous HF made as a byproduct at Paducah, KY, and Portsmouth, OH; fluorspar imports came from Mexico (64%) in 2021-24. (partly U.S.)
The source says
“Domestically, CaF2 was used in the production of anhydrous hydrogen fluoride (HF) in Louisiana and Texas”
“The U.S. Department of Energy continued to produce aqueous HF as a byproduct of the conversion of depleted uranium hexafluoride to depleted uranium oxide at plants in Paducah, KY, and Portsmouth, OH”
“Mexico, 64%; Vietnam, 12%; China,4 10%; South Africa, 9%; and other, 5%.”
Source: USGS Mineral Commodity Summaries 2026, Fluorspar (PDF page 84) (2026-02)
Components and end use
Hydrogen fluoride is the main feedstock for fluorine chemicals such as refrigerants and fluoropolymers. (U.S. role not stated)
The source says
“Aqueous HF is the primary feedstock for the manufacture of virtually all fluorine-bearing chemicals, particularly refrigerants and fluoropolymers”
Source: USGS Mineral Commodity Summaries 2026, Fluorspar (PDF page 84) (2026-02)
Recycling
Primary aluminum producers recycle hydrogen fluoride and fluorides from smelting. (partly U.S.)
The source says
“Primary aluminum producers recycle HF and fluorides from smelting operations.”
Source: USGS Mineral Commodity Summaries 2026, Fluorspar (PDF page 84) (2026-02)
Pilot. Summaries are ours, from official pages; each quoted passage is checked against the saved page. “Bottleneck” (orange dot) is shown only where the quote shows one country dominating the stage or the United States relying on imports for it. “No sourced data yet” means we have not found a source, not that the stage is unproblematic.
Policy and funding
Federal items we track for this mineral, each linked to its original.
Federal awards already made
Ares Strategic Mining, Inc. · Department of Defense · $2M obligated · started 2026-01-15
Source: usaspending.gov, retrieved 2026-10-29
University of Kentucky Research Foundation, The · Institute of Museum and Library Services · $423.2K obligated · started 2022-12-01
Source: usaspending.gov, retrieved 2026-10-29
University of Texas at Austin · Department of the Interior · $330.9K obligated · started 2026-03-01
Source: usaspending.gov, retrieved 2026-10-29
University of Kentucky Research Foundation, The · Department of the Interior · $50.4K obligated · started 2023-08-01
Source: usaspending.gov, retrieved 2026-10-29
The 4 largest of 4 AI-tagged awards from USAspending (last 12 months, found by keyword; some are only loosely about this mineral). See all awards for Fluorspar.
Source: U.S. Department of the Treasury, Bureau of the Fiscal Service, USAspending.gov: spending by award (contracts and grants, last 12 months) (award start dates per item)
Data tables
The USGS figures behind the charts. Click a column heading to sort.
Fluorspar: USGS tables
United States
| Measure | Unit | 2024 | 2025 |
|---|---|---|---|
| Net import reliance as a percentage of apparent consumption | percent | 100 | 100 |
| Production: Finished, metallurgical grade | thousand metric tons | NA | NA |
| Production: Fluorosilicic acid from phosphate rock | thousand metric tons | 45 | 45 |
| Imports for consumption: Acid grade | thousand metric tons | 372 | 360 |
| Imports for consumption: Metallurgical grade | thousand metric tons | 31 | 20 |
| Imports for consumption: Total fluorspar imports | thousand metric tons | 403 | 380 |
| Imports for consumption: Hydrofluoric acid | thousand metric tons | 69 | 76 |
| Imports for consumption: Aluminum fluoride | thousand metric tons | 22 | 20 |
| Imports for consumption: Cryolite | thousand metric tons | 22 | 21 |
| Exports, fluorspar, all grades | thousand metric tons | 14 | 7 |
| Consumption, apparent | thousand metric tons | 390 | 370 |
| Price, average unit value of imports, cost, insurance, and freight, dollars per metric ton: Acid grade | dollars per metric ton | 464 | 470 |
| Price, average unit value of imports, cost, insurance, and freight, dollars per metric ton: Metallurgical grade | dollars per metric ton | 336 | 400 |
| Employment, mine, number | number | 15 | 15 |
World production (thousand metric tons; top 6 of 13, plus other countries)
| Country | 2024 | 2025 | Share |
|---|---|---|---|
| China | 6,000 | 6,000 | 60% |
| Mexico | 1,510 | 1,500 | 15% |
| Mongolia | 1,430 | 1,500 | 15% |
| South Africa | 447 | 410 | 4% |
| Vietnam | 146 | 160 | 2% |
| Spain | 138 | 140 | 1% |
| Other countries | 316 | 200 | 2% |
World total 2025: 10,000 thousand metric tons (as printed by USGS, rounded).
World reserves (thousand metric tons; top 6 of 13, plus other countries)
| Country | 2025 | Share |
|---|---|---|
| China | 110,000 | 33% |
| Mexico | 68,000 | 21% |
| South Africa | 41,000 | 12% |
| Mongolia | 34,000 | 10% |
| Vietnam | 16,000 | 5% |
| Spain | 15,000 | 5% |
| Other countries | 32,000 | 10% |
World total 2025: 330,000 thousand metric tons (as printed by USGS, rounded).
U.S. import sources: All (percent of imports, 2021–24)
| Country | Share (%) |
|---|---|
| Mexico | 64 |
| Vietnam | 12 |
| China | 10 |
| South Africa | 9 |
| Other countries | 5 |
Source: U.S. Geological Survey, Mineral Commodity Summaries 2026: Fluorspar (February 2026)