All fact sheets · The Strata Memo
Copper
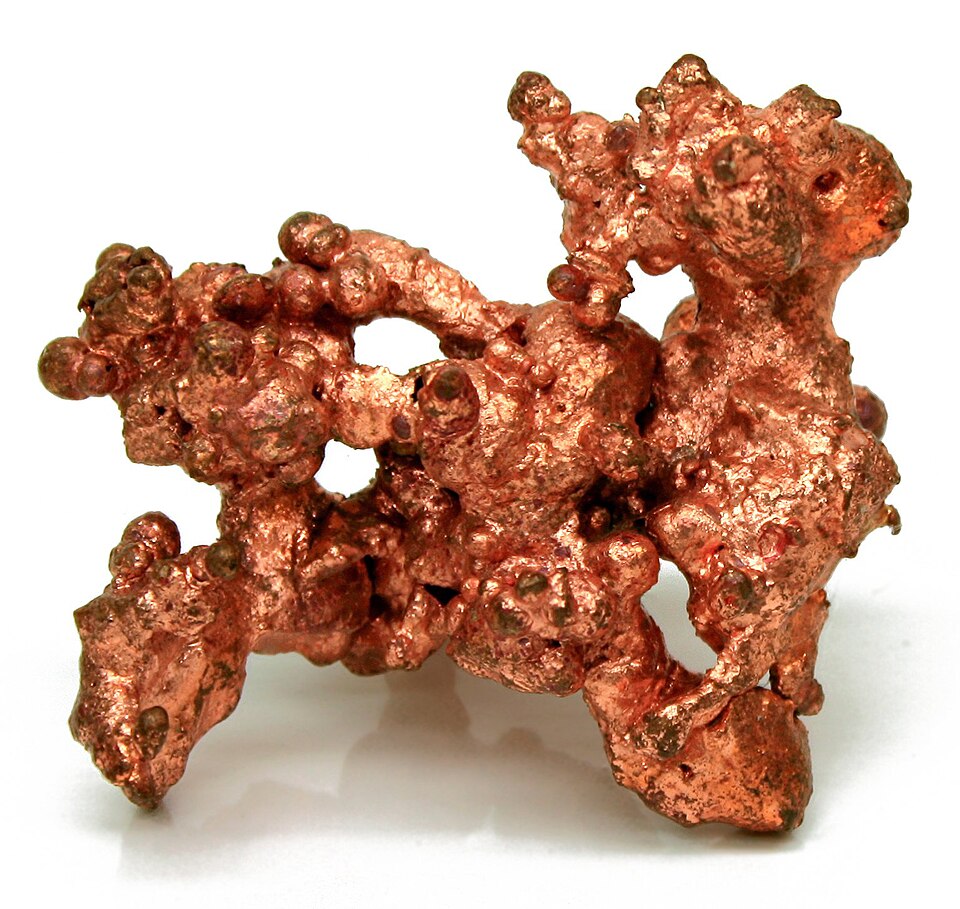

Hover, focus or tap to see the real thing
Photo Native_Copper_Macro_Digon3.jpg : “Jonathan Zander ( Digon3 )" derivative work: Materialscientist ( talk ). “NatCopper.jpg.” CC BY-SA 3.0. Wikimedia Commons. File page
Chemical details
- State at room conditions
- Solid
- Melting point
- 1,358 K (1,085 °C)
- Boiling point
- 2,835 K (2,562 °C)
- Density
- 8.933 g/cm³
- Common oxidation states
- +2, +1
- Electronegativity (Pauling)
- 1.9
- Atomic radius
- 140 pm
- First ionization energy
- 7.726 eV
- Discovered
- Ancient
Source: U.S. National Library of Medicine, PubChem, Periodic Table of Elements (element Copper) (current at retrieval)
On the USGS 2025 List of Critical Minerals. Figures: USGS Mineral Commodity Summaries 2026 (data release, public domain). Estimates are USGS's; check the USGS chapter for notes. Each panel names its source; full citations are in the methodology source register.
Overview
The headline numbers: how much the U.S. depends on imports and how concentrated supply is.
How much does the U.S. import?
of U.S. copper use was met by imports in 2025 (USGS net import reliance).
Source: U.S. Geological Survey, Mineral Commodity Summaries 2026: Copper (February 2026)
Did you know?
Michigan's copper country produced what sources still call the largest single mass of native copper ever found, a lump weighing hundreds of tons.
Two sources; the second is less authoritative or covers it loosely. Verified 2026-10-29.
Sources: Wikipedia · michiganrailroads.com (Minesota Mine entry, citing Mindat) · The Mining Gazette (Houghton, Michigan), "The mighty Minesota" (Wikipedia text is CC BY-SA)
How concentrated is supply?
49% of world production comes from three countries (Chile, Congo (Kinshasa), Peru). Concentrated.
Thirds of the bar: under 33%, 33 to 65%, 66% and over. Our own rule of thumb, not a USGS rating.
Source: U.S. Geological Survey, Mineral Commodity Summaries 2026: Copper (February 2026)
Supply
Who produces it, where the reserves are, where U.S. imports come from, and how U.S. supply has moved.
Who has it, and who digs it?
Where it is produced, 2025
| Name | Value |
|---|---|
| Chile | 23% |
| Congo (Kinshasa) | 14% |
| Peru | 12% |
| China | 8% |
| Russia | 6% |
| United States | 4% |
Where the reserves are
| Name | Value |
|---|---|
| Chile | 18% |
| Australia | 10% |
| Peru | 9% |
| Congo (Kinshasa) | 8% |
| Russia | 8% |
| Mexico | 5% |
Share of the world total as printed by USGS (rounded). Production and reserves are different things: reserves are what is economic to mine. Hover or focus a bar for its value, or switch to the table view.
Source: U.S. Geological Survey, Mineral Commodity Summaries 2026: Copper (February 2026)
Where U.S. imports come from
Choose a data set, then a view. A country keeps the same color in every chart on this page. Grey means other countries, or a country beyond the seven colors (always labeled). Hover or focus a mark for its value, or use the table view.
- Finland88%
- Malaysia3%
- United Kingdom3%
- Other countries6%
| Country | Share of U.S. imports | Share of this chart |
|---|---|---|
| Finland | 88% | 88.0% |
| Malaysia | 3% | 3.0% |
| United Kingdom | 3% | 3.0% |
| Other countries | 6% | 6.0% |
Average share of U.S. imports of copper content of blister and anodes, 2021–24, as printed by USGS (rounded, so shares may not sum to 100). Other countries are USGS's own grouping.
Source: U.S. Geological Survey, Mineral Commodity Summaries 2026: Copper (February 2026)
- Canada52%
- Belgium24%
- Japan9%
- Spain6%
- Other countries9%
| Country | Share of U.S. imports | Share of this chart |
|---|---|---|
| Canada | 52% | 52.0% |
| Belgium | 24% | 24.0% |
| Japan | 9% | 9.0% |
| Spain | 6% | 6.0% |
| Other countries | 9% | 9.0% |
Average share of U.S. imports of copper content of matte, ash, and precipitate, 2021–24, as printed by USGS (rounded, so shares may not sum to 100). Other countries are USGS's own grouping.
Source: U.S. Geological Survey, Mineral Commodity Summaries 2026: Copper (February 2026)
- Canada45%
- Mexico43%
- Other countries12%
| Country | Share of U.S. imports | Share of this chart |
|---|---|---|
| Canada | 45% | 45.0% |
| Mexico | 43% | 43.0% |
| Other countries | 12% | 12.0% |
Average share of U.S. imports of copper content of scrap, 2021–24, as printed by USGS (rounded, so shares may not sum to 100). Other countries are USGS's own grouping.
Source: U.S. Geological Survey, Mineral Commodity Summaries 2026: Copper (February 2026)
- Chile68%
- Canada16%
- Peru7%
- Mexico6%
- Other countries3%
| Country | Share of U.S. imports | Share of this chart |
|---|---|---|
| Chile | 68% | 68.0% |
| Canada | 16% | 16.0% |
| Peru | 7% | 7.0% |
| Mexico | 6% | 6.0% |
| Other countries | 3% | 3.0% |
Average share of U.S. imports of refined copper, 2021–24, as printed by USGS (rounded, so shares may not sum to 100). Other countries are USGS's own grouping.
Source: U.S. Geological Survey, Mineral Commodity Summaries 2026: Copper (February 2026)
- Japan37% · $221K
- United Kingdom15% · $90K
- Canada11% · $65K
- Thailand9% · $53K
- China8% · $47K
- Hungary7% · $42K
- All other countries14% · $86K
| Country | U.S. imports, 2025 | Share of this chart |
|---|---|---|
| Japan | 37% · $221K | 36.7% |
| United Kingdom | 15% · $90K | 14.9% |
| Canada | 11% · $65K | 10.8% |
| Thailand | 9% · $53K | 8.7% |
| China | 8% · $47K | 7.8% |
| Hungary | 7% · $42K | 6.9% |
| All other countries | 14% · $86K | 14.2% |
U.S. general imports (customs value) in calendar 2025 under HS 2603; countries beyond the top six are grouped. The code can include goods beyond this mineral. The Shift view compares each country's share of 2025 with its share of Jan to Aug 2026 (shares of each period's total).
Source: U.S. Census Bureau, International Trade API: U.S. imports by HS code and country (calendar 2025; Jan to Aug 2026) (data months 2025-12, 2026-08)
- Malaysia35% · $779K
- India29% · $638K
- Finland22% · $481K
- Korea, South3% · $73K
- Japan3% · $57K
- Belgium2% · $54K
- All other countries7% · $145K
| Country | U.S. imports, 2025 | Share of this chart |
|---|---|---|
| Malaysia | 35% · $779K | 35.0% |
| India | 29% · $638K | 28.7% |
| Finland | 22% · $481K | 21.6% |
| Korea, South | 3% · $73K | 3.3% |
| Japan | 3% · $57K | 2.6% |
| Belgium | 2% · $54K | 2.4% |
| All other countries | 7% · $145K | 6.5% |
U.S. general imports (customs value) in calendar 2025 under HS 7402; countries beyond the top six are grouped. The code can include goods beyond this mineral. The Shift view compares each country's share of 2025 with its share of Jan to Aug 2026 (shares of each period's total).
Source: U.S. Census Bureau, International Trade API: U.S. imports by HS code and country (calendar 2025; Jan to Aug 2026) (data months 2025-12, 2026-08)
- Chile54% · $8.9B
- Canada12% · $2.1B
- Democratic Republic Of The Congo11% · $1.8B
- Peru5% · $884.2M
- Australia4% · $701.3M
- Korea, South4% · $677.4M
- All other countries10% · $1.6B
| Country | U.S. imports, 2025 | Share of this chart |
|---|---|---|
| Chile | 54% · $8.9B | 53.5% |
| Canada | 12% · $2.1B | 12.4% |
| Democratic Republic Of The Congo | 11% · $1.8B | 10.8% |
| Peru | 5% · $884.2M | 5.3% |
| Australia | 4% · $701.3M | 4.2% |
| Korea, South | 4% · $677.4M | 4.1% |
| All other countries | 10% · $1.6B | 9.7% |
U.S. general imports (customs value) in calendar 2025 under HS 7403; countries beyond the top six are grouped. The code can include goods beyond this mineral. The Shift view compares each country's share of 2025 with its share of Jan to Aug 2026 (shares of each period's total).
Source: U.S. Census Bureau, International Trade API: U.S. imports by HS code and country (calendar 2025; Jan to Aug 2026) (data months 2025-12, 2026-08)
U.S. supply mix
thousand metric tons, 2021 to 2025
Imports are before exports, so the stack is not the same as U.S. consumption.
Source: U.S. Geological Survey, Mineral Commodity Summaries 2026: Copper (February 2026)
Price
Price, annual average, cents per pound: U.S. producer, cathode (COMEX + premium)
Source: U.S. Geological Survey, Mineral Commodity Summaries 2026: Copper (February 2026)
Trade and tariffs
Tariff codes and the countries behind U.S. imports and exports.
Trade codes and tariffs
| HTS code | What it covers | Normal rate | Column 2 rate |
|---|---|---|---|
| 2603 | Copper ores and concentrates | 1.7¢/kg on lead content | 8.8¢/kg on copper content + 3.3¢/kg on lead content + 3.7¢/kg on zinc content |
| 7402 | Unrefined copper; copper anodes for electrolytic refining | Free | 6% |
| 7403 | Refined copper and copper alloys, unwrought (other than master alloys of heading 7405) | 1% * | 6% |
Rates from the U.S. Harmonized Tariff Schedule (USITC, saved 2026-10-26). The normal rate is column 1 general; column 2 applies to countries without normal trade relations. A range means different products under the code have different rates. An asterisk means the schedule footnotes point to Chapter 99 additional-duty headings. Section 232, Section 301, emergency tariffs and antidumping or countervailing duties are set in separate notices and are not shown. Look up any code at hts.usitc.gov. These are the main codes for this mineral, not a complete list.
Source: U.S. International Trade Commission, Harmonized Tariff Schedule of the United States, general and column 2 rates (edition current when saved)
U.S. trade by country
U.S. imports in 2025 by source country, code 7403
| Name | Value |
|---|---|
| Chile | 54% · $8.9B |
| Canada | 12% · $2.1B |
| Democratic Republic Of The Congo | 11% · $1.8B |
| Peru | 5% · $884.2M |
| Australia | 4% · $701.3M |
| Korea, South | 4% · $677.4M |
U.S. exports in 2025 by destination, code 2603
| Name | Value |
|---|---|
| Mexico | 65% · $2.3B |
| Canada | 22% · $774.4M |
| Germany | 3% · $111.9M |
| Japan | 3% · $111.2M |
| China | 3% · $100.8M |
| Malaysia | 3% · $95.2M |
2603 Copper ores and concentrates
Top import sources Japan 37%, United Kingdom 15%, Canada 11%
Top export destinations Mexico 65%, Canada 22%, Germany 3%
7402 Unrefnd cppr; cppr anods f elctroltc refining
Top import sources Malaysia 35%, India 29%, Finland 22%
Top export destinations Canada 95%, Korea, South 1%, Spain 1%
7403 Refined copper & alloys (no mast alloy), unwrought
Top import sources Chile 54%, Canada 12%, Democratic Republic Of The Congo 11%
Top export destinations Mexico 81%, Canada 12%, Germany 2%
U.S. Census Bureau International Trade API, saved 2026-10-26. Imports are general imports (customs value) and exports are total exports, in U.S. dollars. Duty collected is Census's calculated duty on imports for consumption. Figures cover every 10-digit product under the code, so they can include goods beyond this mineral, and the duty shown is not split into Section 232, Section 301 or antidumping duties. Bars show the largest code for each direction. Group rows such as the EU or OECD are left out so no country is counted twice.
Source: U.S. Census Bureau, International Trade API: U.S. imports and exports by HS code and country (calendar 2025, and January to Aug 2026) (data months 2025-12, 2026-08)
Value chain and risk
Where in the chain the bottlenecks sit, and what other governments and sources say about supply risk.
Value chain: where the bottlenecks are
Mining
U.S. mines produced an estimated 1.0 million tons of copper in 2025, about 70% of it in Arizona. (U.S. activity)
The source says
“the recoverable copper content of U.S. mine production was an estimated 1.0 million tons”
“Arizona was the leading copper-producing State and accounted for approximately 70% of domestic output”
Source: USGS Mineral Commodity Summaries 2026, Copper (PDF page 76) (2026-02)
Ore processing and primary recovery
Freeport-McMoRan's Morenci, Bagdad and Sierrita operations each include a concentrator that produces copper concentrate. (U.S. activity)
The source says
“The Morenci operation consists of two concentrators capable of milling 132,000 metric tons of ore per day (mtd), which produce copper and molybdenum concentrate;”
“The Bagdad operation consists of an 77,100 metric ton-per-day concentrator that produces copper and molybdenum concentrate”
“The Sierrita operation includes a 100,000 metric ton-per-day concentrator that produces copper and molybdenum concentrate.”
Source: Freeport-McMoRan, Operations: North America (United States) (2026)
Refining and separation
U.S. copper is processed at 2 primary smelters and 2 primary electrolytic refineries, among other facilities; refined output fell about 9% in 2025 after maintenance at both smelters. (U.S. activity)
The source says
“2 primary smelters, 2 secondary smelters, 2 primary electrolytic refineries, 14 electrowon refineries, and 4 secondary refineries.”
“Domestic output of refined copper decreased by an estimated 9% compared with that in 2024 owing to planned maintenance of both primary smelters.”
Source: USGS Mineral Commodity Summaries 2026, Copper (PDF page 76) (2026-02)
Metal, alloy and chemical
Refined copper imports came from Chile (68%), Canada (16%) and Peru (7%) in 2021-24. (partly U.S.)
The source says
“Refined copper: Chile, 68%; Canada, 16%; Peru, 7%; Mexico, 6%; and other, 3%.”
Source: USGS Mineral Commodity Summaries 2026, Copper (PDF page 76) (2026-02)
Components and end use
Building construction took 42% of copper and copper alloy products, then electrical and electronic products (23%) and transportation equipment (18%). (U.S. role not stated)
The source says
“copper and copper alloy products were used in building construction, 42%; electrical and electronic products, 23%; transportation equipment, 18%”
Source: USGS Mineral Commodity Summaries 2026, Copper (PDF page 76) (2026-02)
Recycling
Scrap supplied about 30% of the U.S. copper supply. (U.S. activity)
The source says
“Copper recovered from scrap contributed about 30% of the U.S. copper supply.”
Source: USGS Mineral Commodity Summaries 2026, Copper (PDF page 76) (2026-02)
Pilot. Summaries are ours, from official pages; each quoted passage is checked against the saved page. “Bottleneck” (orange dot) is shown only where the quote shows one country dominating the stage or the United States relying on imports for it. “No sourced data yet” means we have not found a source, not that the stage is unproblematic.
Mines, plants and partners
Named facilities with their operators and locations, as each source describes them on the date shown. 14 sourced entries for Copper.
Mining
Freeport-McMoRan (72% undivided interest; Sumitomo Metal Mining Arizona Inc. 15%; SMM Morenci Inc. 13%)
Greenlee County, Arizona, United States · Operating
The source says
“72% - Freeport-McMoRan Inc. (undivided interest); 15% - Sumitomo Metal Mining Arizona Inc. (SMMAz is owned 80% by Sumitomo Metal Mining Co. Ltd. (SMM) and 20% by Sumitomo Corporation); and 13% - SMM Morenci Inc. (fully owned by SMM)”
“Greenlee County, Arizona, approximately 50 miles northeast of Safford on U.S. Highway 191.”
“Morenci is an open-pit copper mining complex that has been in continuous operation since 1939”
Source: Freeport-McMoRan, Operations: North America (United States) (2026)
Freeport-McMoRan (100%)
About 100 miles northwest of Phoenix, Arizona, United States · Operating
The source says
“BAGDAD MINE LOCATED IN ARIZONA”
“About 100 miles northwest of Phoenix, Arizona.”
“The Bagdad operation consists of an 77,100 metric ton-per-day concentrator that produces copper and molybdenum concentrate”
Source: Freeport-McMoRan, Operations: North America (United States) (2026)
Freeport-McMoRan (100%)
20 miles southwest of Tucson, Arizona, United States · Operating
The source says
“Sierrita is an open-pit copper and molybdenum mining complex.”
“20 miles southwest of Tucson, Arizona.”
“The Sierrita operation includes a 100,000 metric ton-per-day concentrator that produces copper and molybdenum concentrate.”
Source: Freeport-McMoRan, Operations: North America (United States) (2026)
Freeport-McMoRan (100%)
Southeast Arizona, 170 miles east of Phoenix, United States · Operating
The source says
“SAFFORD/LONE STAR MINE LOCATED IN ARIZONA”
“Safford is an open-pit copper mining complex.”
“Southeast Arizona, 170 miles east of Phoenix.”
Source: Freeport-McMoRan, Operations: North America (United States) (2026)
Rio Tinto (Kennecott)
Just outside Salt Lake City, Utah, United States · Operating
The source says
“Our Kennecott mine is a world-class, integrated copper mining operation located just outside Salt Lake City, Utah, in the US.”
“Our operation encompasses surface and underground mines, a concentrator, smelter, and refinery, as well as rail infrastructure and a tailings storage facility.”
“Kennecott has been mining and processing minerals from the rich ore body of the Bingham Canyon Mine since 1903.”
Source: Rio Tinto, Kennecott (Utah, US) (2026)
Codelco (Corporación Nacional del Cobre de Chile, state-owned)
Calama, Región de Antofagasta, Chile · Operating
The source says
“El nombre Codelco representa a la Corporación Nacional del Cobre de Chile, una empresa autónoma propiedad del Estado chileno.”
“Este trabajo lo realiza a través de siete divisiones mineras: Chuquicamata, Ministro Hales, Radomiro Tomic, Gabriela Mistral, Salvador, Andina, El Teniente, además de la Fundición y Refinería Ventanas.”
“Complejo minero a cielo abierto, ubicado a 2.870 metros de altitud, en Calama, Región de Antofagasta.”
Source: Consejo Minero (Chilean mining council), Codelco member profile (2026)
Codelco (Corporación Nacional del Cobre de Chile, state-owned)
Machalí, Región del Libertador Bernardo O’Higgins, Chile · Operating
The source says
“El nombre Codelco representa a la Corporación Nacional del Cobre de Chile, una empresa autónoma propiedad del Estado chileno.”
“Mina subterránea y mina a rajo abierto, ubicada a 2.500 metros de altitud en la cordillera de Los Andes, Machalí, Región del Libertador Bernardo O’Higgins.”
“Productos: Ánodos y concentrado de cobre.”
Source: Consejo Minero (Chilean mining council), Codelco member profile (2026)
Freeport-McMoRan (55.66%; SMM Cerro Verde Netherlands 21%; Compañia de Minas Buenaventura 19.58%)
About 20 miles southwest of Arequipa, Peru · Operating
The source says
“Approximately 20 miles southwest of Arequipa, Peru.”
“55.66% FCX; 21% SMM Cerro Verde Netherlands B.V. (a subsidiary of Sumitomo Metal Mining Company Ltd.); 19.58% Compañia de Minas Buenaventura S.A.A.; and 3.76% by other shareholders whose shares are publicly traded on the Lima Stock Exchange.”
“Cerro Verde’s operation includes 2 concentrating facilities with an annual average permitted milling capacity of 409,500 metric tons of ore per day.”
Source: Freeport-McMoRan, Operations: South America (2026)
PT Freeport Indonesia (PTFI; Freeport-McMoRan)
Sudirman Mountain Range, Papua province, Indonesia · Operating
The source says
“PT Freeport Indonesia (PTFI) commenced mining operations in 1972 and in 1988 discovered the Grasberg mine.”
“The remote highlands of the Sudirman Mountain Range in the province of Papua, Indonesia, which is on the western half of the island of New Guinea.”
“The Grasberg minerals district includes the following underground mines that are being operated; the Grasberg Block Cave, the Deep Mill Level Zone (DMLZ) and Big Gossan.”
Source: Freeport-McMoRan, Operations: Indonesia (2026)
Ore processing and primary recovery
Freeport-McMoRan (72% undivided interest; Sumitomo Metal Mining Arizona Inc. 15%; SMM Morenci Inc. 13%)
Greenlee County, Arizona, United States · Operating
The source says
“The Morenci operation consists of two concentrators capable of milling 132,000 metric tons of ore per day (mtd), which produce copper and molybdenum concentrate;”
“Greenlee County, Arizona, approximately 50 miles northeast of Safford on U.S. Highway 191.”
“72% - Freeport-McMoRan Inc. (undivided interest); 15% - Sumitomo Metal Mining Arizona Inc. (SMMAz is owned 80% by Sumitomo Metal Mining Co. Ltd. (SMM) and 20% by Sumitomo Corporation); and 13% - SMM Morenci Inc. (fully owned by SMM)”
Source: Freeport-McMoRan, Operations: North America (United States) (2026)
Refining and separation
Freeport-McMoRan
Miami, Arizona (Globe-Miami mining district, 90 miles east of Phoenix), United States · Operating
The source says
“Miami includes an open-pit copper mine, a smelter and a rod mill.”
“90 miles east of Phoenix, in the heart of Arizona’s historic Globe-Miami mining district.”
“The Miami smelter processes copper concentrate primarily from FCX’s Arizona copper mines.”
Source: Freeport-McMoRan, Operations: North America (United States) (2026)
Freeport-McMoRan (100%)
El Paso, Texas, United States · Operating
The source says
“The El Paso refinery has the potential to operate at an annual production capacity of about 900 million pounds of copper cathode, which is sufficient to refine all of the copper anode we produce at our Miami, Arizona operation.”
“The Copper Refinery and Rod Mill is located in east-central El Paso, which is in the far western corner of Texas near the U.S.-Mexico border and the Rio Grande River.”
“Our El Paso refinery also produces nickel carbonate, copper telluride and autoclaved slimes material containing gold, silver, platinum and palladium.”
Source: Freeport-McMoRan, Operations: North America (United States) (2026)
Rio Tinto (Kennecott)
Just outside Salt Lake City, Utah, United States · Operating
The source says
“Our Kennecott mine is a world-class, integrated copper mining operation located just outside Salt Lake City, Utah, in the US.”
“Our operation encompasses surface and underground mines, a concentrator, smelter, and refinery, as well as rail infrastructure and a tailings storage facility.”
“Kennecott produces both minerals and operates one of only 2 copper smelters in the US, reinforcing its strategic role.”
Source: Rio Tinto, Kennecott (Utah, US) (2026)
Rio Tinto (Kennecott)
Just outside Salt Lake City, Utah, United States · Operating
The source says
“Our Kennecott mine is a world-class, integrated copper mining operation located just outside Salt Lake City, Utah, in the US.”
“Our operation encompasses surface and underground mines, a concentrator, smelter, and refinery, as well as rail infrastructure and a tailings storage facility.”
“The $10 million, 6.2 MW combined heat and power (CHP) system – large enough to power 6,000 average-sized homes – is one example of how we are doing this, generating enough power to supply up to 50% of the electrical needs of the refinery.”
Source: Rio Tinto, Kennecott (Utah, US) (2026)
A curated list, not a complete register: it shows facilities we could confirm in a source page, and a missing name means we have not sourced it, not that it does not exist. Each quoted passage is checked against the saved page. Partnerships are listed only where the source states them.
Policy and funding
Federal items we track for this mineral, each linked to its original.
Policy timeline
Tagged by AI from federal sources; each links to the original. How we label.
Source: U.S. federal sources (Federal Register, Grants.gov, DOE, Regulations.gov, DFC), Policy items tagged for Copper (dates per item)
Federal awards already made
Wieland North America Recycling LLC · Department of Energy · $270M obligated · started 2025-01-01
Source: usaspending.gov, retrieved 2026-10-29
American Battery Technology Company · Department of Energy · $147.6M obligated · started 2025-01-01
Source: usaspending.gov, retrieved 2026-10-29
Massachusetts Institute of Technology · National Science Foundation · $3M obligated · started 2026-09-01
Source: usaspending.gov, retrieved 2026-10-29
The Trustees of Columbia University in the City of New York · Department of Energy · $2.5M obligated · started 2023-02-09
Source: usaspending.gov, retrieved 2026-10-29
Deep Blue Geophysics, LLC · Department of Energy · $2.2M obligated · started 2026-07-24
Source: usaspending.gov, retrieved 2026-10-29
The 5 largest of 12 AI-tagged awards from USAspending (last 12 months, found by keyword; some are only loosely about this mineral). See all awards for Copper.
Source: U.S. Department of the Treasury, Bureau of the Fiscal Service, USAspending.gov: spending by award (contracts and grants, last 12 months) (award start dates per item)
Data tables
The USGS figures behind the charts. Click a column heading to sort.
Copper: USGS tables
United States
| Measure | Unit | 2024 | 2025 |
|---|---|---|---|
| Net import reliance as a percentage of apparent consumption | percent | 45 | 57 |
| Production: Mine, recoverable | thousand metric tons | 1,050 | 1,000 |
| Production, Refinery: Primary (from ore) | thousand metric tons | 882 | 790 |
| Production, Refinery: Secondary (from scrap) | thousand metric tons | 39 | 60 |
| Copper recovered from old (post-consumer) scrap | thousand metric tons | 140 | 160 |
| Imports for consumption: Ore and concentrate | thousand metric tons | s | s |
| Imports for consumption: Refined | thousand metric tons | 903 | 1,700 |
| Exports: Ore and concentrate | thousand metric tons | 326 | 340 |
| Exports: Refined | thousand metric tons | 72 | 110 |
| Consumption: Reported, refined copper | thousand metric tons | 1,580 | 1,700 |
| Consumption: Apparent, primary refined copper and copper from old scrap | thousand metric tons | 1,860 | 2,200 |
| Price, annual average, cents per pound: U.S. producer, cathode (COMEX + premium) | cents per pound | 431.8 | 490 |
| Price, annual average, cents per pound: COMEX, high-grade, first position | cents per pound | 421.6 | 480 |
| Price, annual average, cents per pound: London Metal Exchange, grade A, cash | cents per pound | 414.7 | 440 |
| Stocks, refined, held by U.S. producers, consumers, and metal exchanges, yearend | thousand metric tons | 123 | 450 |
| Employment, mine and plant, number | number | 13,000 | 13,000 |
World production (thousand metric tons; top 6 of 17, plus other countries)
| Country | 2024 | 2025 | Share |
|---|---|---|---|
| Chile | 5,510 | 5,300 | 23% |
| Congo (Kinshasa) | 2,990 | 3,200 | 14% |
| Peru | 2,740 | 2,700 | 12% |
| China | 1,840 | 1,800 | 8% |
| Russia | 1,020 | 1,300 | 6% |
| United States | 1,050 | 1,000 | 4% |
| Other countries | 2,850 | 3,000 | 13% |
World total 2025: 23,000 thousand metric tons (as printed by USGS, rounded).
World production: Refinery production (thousand metric tons; top 6 of 17, plus other countries)
| Country | 2024 | 2025 | Share |
|---|---|---|---|
| China | 12,400 | 14,000 | 48% |
| Congo (Kinshasa) | 2,560 | 2,800 | 10% |
| Chile | 1,940 | 1,700 | 6% |
| Japan | 1,570 | 1,400 | 5% |
| Russia | 896 | 950 | 3% |
| United States | 921 | 850 | 3% |
| Other countries | 2,310 | 2,100 | 7% |
World total 2025: 29,000 thousand metric tons (as printed by USGS, rounded).
World reserves (thousand metric tons; top 6 of 17, plus other countries)
| Country | 2025 | Share |
|---|---|---|
| Chile | 180,000 | 18% |
| Australia | 100,000 | 10% |
| Peru | 85,000 | 9% |
| Congo (Kinshasa) | 80,000 | 8% |
| Russia | 80,000 | 8% |
| Mexico | 53,000 | 5% |
| Other countries | 210,000 | 21% |
World total 2025: 980,000 thousand metric tons (as printed by USGS, rounded).
U.S. import sources: Copper content of blister and anodes (percent of imports, 2021–24)
| Country | Share (%) |
|---|---|
| Finland | 88 |
| Malaysia | 3 |
| United Kingdom | 3 |
| Other countries | 6 |
U.S. import sources: Copper content of matte, ash, and precipitate (percent of imports, 2021–24)
| Country | Share (%) |
|---|---|
| Canada | 52 |
| Belgium | 24 |
| Japan | 9 |
| Spain | 6 |
| Other countries | 9 |
U.S. import sources: Copper content of ore and concentrate (percent of imports, 2021–24)
| Country | Share (%) |
|---|---|
| Canada | >99 |
| Other countries | <1 |
U.S. import sources: Copper content of scrap (percent of imports, 2021–24)
| Country | Share (%) |
|---|---|
| Canada | 45 |
| Mexico | 43 |
| Other countries | 12 |
U.S. import sources: Refined copper (percent of imports, 2021–24)
| Country | Share (%) |
|---|---|
| Chile | 68 |
| Canada | 16 |
| Peru | 7 |
| Mexico | 6 |
| Other countries | 3 |
Source: U.S. Geological Survey, Mineral Commodity Summaries 2026: Copper (February 2026)