All fact sheets · The Strata Memo
Cobalt
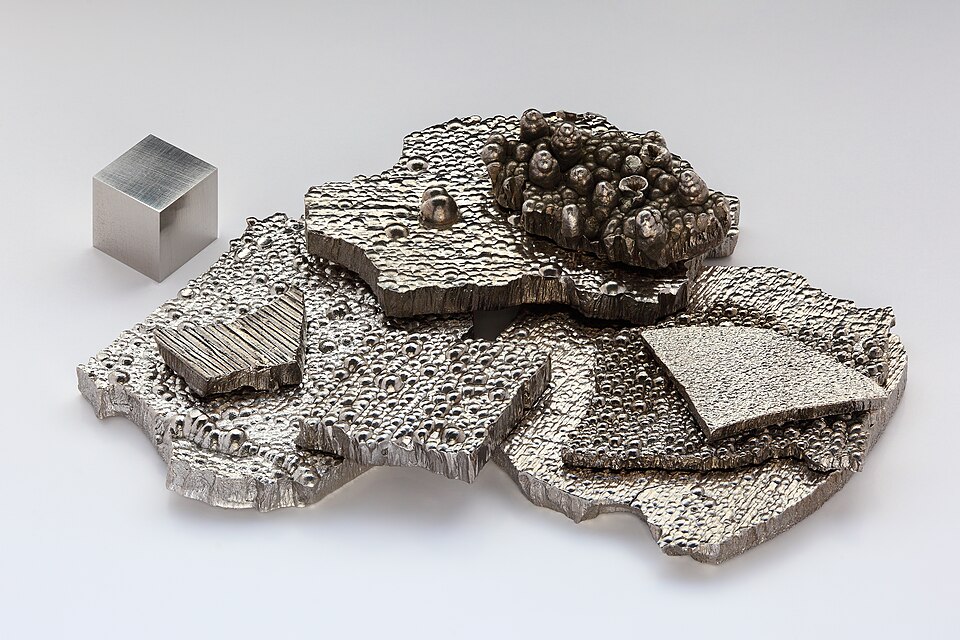

Hover, focus or tap to see the real thing
Photo Alchemist-hp ( talk ) ( www.pse-mendelejew.de ). “Kobalt electrolytic and 1cm3 cube.jpg.” FAL. Wikimedia Commons. File page
Chemical details
- State at room conditions
- Solid
- Melting point
- 1,768 K (1,495 °C)
- Boiling point
- 3,200 K (2,927 °C)
- Density
- 8.86 g/cm³
- Common oxidation states
- +3, +2
- Electronegativity (Pauling)
- 1.88
- Atomic radius
- 192 pm
- First ionization energy
- 7.881 eV
- Discovered
- 1735
Source: U.S. National Library of Medicine, PubChem, Periodic Table of Elements (element Cobalt) (current at retrieval)
On the USGS 2025 List of Critical Minerals. Figures: USGS Mineral Commodity Summaries 2026 (data release, public domain). Estimates are USGS's; check the USGS chapter for notes. Each panel names its source; full citations are in the methodology source register.
Overview
The headline numbers: how much the U.S. depends on imports and how concentrated supply is.
How much does the U.S. import?
of U.S. cobalt use was met by imports in 2025 (USGS net import reliance).
Source: U.S. Geological Survey, Mineral Commodity Summaries 2026: Cobalt (February 2026)
Did you know?
Cobalt's name comes from "kobold": German silver miners blamed a troublesome ore on a mischievous spirit of folklore. Later, Georg Brandt showed that cobalt, not bismuth, was what made blue glass blue.
Checked against two independent sources. Verified 2026-10-26.
Sources: Wikipedia · Linda Hall Library · Science Friday (Wikipedia text is CC BY-SA)
How concentrated is supply?
91% of world production comes from three countries (Congo (Kinshasa), Indonesia, Russia). Highly concentrated.
Thirds of the bar: under 33%, 33 to 65%, 66% and over. Our own rule of thumb, not a USGS rating.
Source: U.S. Geological Survey, Mineral Commodity Summaries 2026: Cobalt (February 2026)
Supply
Who produces it, where the reserves are, where U.S. imports come from, and how U.S. supply has moved.
Who has it, and who digs it?
Where it is produced, 2025
| Name | Value |
|---|---|
| Congo (Kinshasa) | 74% |
| Indonesia | 14% |
| Russia | 2% |
| Madagascar | 1% |
| Australia | 1% |
| Philippines | 1% |
Where the reserves are
| Name | Value |
|---|---|
| Congo (Kinshasa) | 50% |
| Australia | 14% |
| Russia | 7% |
| Indonesia | 6% |
| Cuba | 4% |
| Philippines | 2% |
Share of the world total as printed by USGS (rounded). Production and reserves are different things: reserves are what is economic to mine. Hover or focus a bar for its value, or switch to the table view.
Source: U.S. Geological Survey, Mineral Commodity Summaries 2026: Cobalt (February 2026)
Where U.S. imports come from
Choose a data set, then a view. A country keeps the same color in every chart on this page. Grey means other countries, or a country beyond the seven colors (always labeled). Hover or focus a mark for its value, or use the table view.
- Norway26%
- Finland16%
- Canada14%
- Japan14%
- Other countries30%
| Country | Share of U.S. imports | Share of this chart |
|---|---|---|
| Norway | 26% | 26.0% |
| Finland | 16% | 16.0% |
| Canada | 14% | 14.0% |
| Japan | 14% | 14.0% |
| Other countries | 30% | 30.0% |
Average share of U.S. imports of metal, oxide, and salts, 2021–24, as printed by USGS (rounded, so shares may not sum to 100). Other countries are USGS's own grouping.
Source: U.S. Geological Survey, Mineral Commodity Summaries 2026: Cobalt (February 2026)
- Germany99% · $137K
- Spain1% · $2K
| Country | U.S. imports, 2025 | Share of this chart |
|---|---|---|
| Germany | 99% · $137K | 98.5% |
| Spain | 1% · $2K | 1.5% |
U.S. general imports (customs value) in calendar 2025 under HS 2605; countries beyond the top six are grouped. The code can include goods beyond this mineral. The Shift view compares each country's share of 2025 with its share of Jan to Aug 2026 (shares of each period's total).
Source: U.S. Census Bureau, International Trade API: U.S. imports by HS code and country (calendar 2025; Jan to Aug 2026) (data months 2025-12, 2026-08)
- Canada18% · $88.8M
- Norway16% · $78.3M
- Japan13% · $61.6M
- Indonesia13% · $61.2M
- United Kingdom9% · $41.5M
- Madagascar9% · $41.3M
- All other countries23% · $111.3M
| Country | U.S. imports, 2025 | Share of this chart |
|---|---|---|
| Canada | 18% · $88.8M | 18.3% |
| Norway | 16% · $78.3M | 16.2% |
| Japan | 13% · $61.6M | 12.7% |
| Indonesia | 13% · $61.2M | 12.6% |
| United Kingdom | 9% · $41.5M | 8.6% |
| Madagascar | 9% · $41.3M | 8.5% |
| All other countries | 23% · $111.3M | 23.0% |
U.S. general imports (customs value) in calendar 2025 under HS 8105; countries beyond the top six are grouped. The code can include goods beyond this mineral. The Shift view compares each country's share of 2025 with its share of Jan to Aug 2026 (shares of each period's total).
Source: U.S. Census Bureau, International Trade API: U.S. imports by HS code and country (calendar 2025; Jan to Aug 2026) (data months 2025-12, 2026-08)
- Finland57% · $22.9M
- Belgium22% · $8.8M
- United Kingdom17% · $6.7M
- China2% · $746K
- Netherlands1% · $553K
- Czech Republic1% · $252K
| Country | U.S. imports, 2025 | Share of this chart |
|---|---|---|
| Finland | 57% · $22.9M | 57.3% |
| Belgium | 22% · $8.8M | 22.0% |
| United Kingdom | 17% · $6.7M | 16.8% |
| China | 2% · $746K | 1.9% |
| Netherlands | 1% · $553K | 1.4% |
| Czech Republic | 1% · $252K | 0.6% |
U.S. general imports (customs value) in calendar 2025 under HS 2822; countries beyond the top six are grouped. The code can include goods beyond this mineral. The Shift view compares each country's share of 2025 with its share of Jan to Aug 2026 (shares of each period's total).
Source: U.S. Census Bureau, International Trade API: U.S. imports by HS code and country (calendar 2025; Jan to Aug 2026) (data months 2025-12, 2026-08)
U.S. supply mix
metric tons, 2021 to 2025
Imports are before exports, so the stack is not the same as U.S. consumption.
Source: U.S. Geological Survey, Mineral Commodity Summaries 2026: Cobalt (February 2026)
Price
Price, average, dollars per pound: U.S. spot, cathode
Source: U.S. Geological Survey, Mineral Commodity Summaries 2026: Cobalt (February 2026)
Trade and tariffs
Tariff codes and the countries behind U.S. imports and exports.
Trade codes and tariffs
| HTS code | What it covers | Normal rate | Column 2 rate |
|---|---|---|---|
| 2605 | Cobalt ores and concentrates | Free | Free |
| 8105 | Cobalt mattes and other intermediate products of cobalt metallurgy; cobalt and articles thereof, including waste and scrap | Free to 4.4% | Free to 45% |
| 2822 | Cobalt oxides and hydroxides; commercial cobalt oxides | 0.1% | 1.7% |
Rates from the U.S. Harmonized Tariff Schedule (USITC, saved 2026-10-26). The normal rate is column 1 general; column 2 applies to countries without normal trade relations. A range means different products under the code have different rates. Section 232, Section 301, emergency tariffs and antidumping or countervailing duties are set in separate notices and are not shown. Look up any code at hts.usitc.gov. These are the main codes for this mineral, not a complete list.
Source: U.S. International Trade Commission, Harmonized Tariff Schedule of the United States, general and column 2 rates (edition current when saved)
U.S. trade by country
U.S. imports in 2025 by source country, code 8105
| Name | Value |
|---|---|
| Canada | 18% · $88.8M |
| Norway | 16% · $78.3M |
| Japan | 13% · $61.6M |
| Indonesia | 13% · $61.2M |
| United Kingdom | 9% · $41.5M |
| Madagascar | 9% · $41.3M |
U.S. exports in 2025 by destination, code 8105
| Name | Value |
|---|---|
| Ireland | 14% · $59.0M |
| France | 12% · $51.8M |
| United Kingdom | 8% · $34.6M |
| Germany | 8% · $34.2M |
| China | 8% · $33.9M |
| Canada | 7% · $28.1M |
2605 Cobalt ores and concentrates
Top import sources Germany 99%, Spain 1%
Top export destinations Malaysia 100%
8105 Cobalt mattes etc, cobalt & art, inc waste & scrap
Top import sources Canada 18%, Norway 16%, Japan 13%
Top export destinations Ireland 14%, France 12%, United Kingdom 8%
2822 Cobalt oxide & hydroxide; commercial cobalt oxides
Top import sources Finland 57%, Belgium 22%, United Kingdom 17%
Top export destinations Mexico 44%, China 22%, Korea, South 11%
U.S. Census Bureau International Trade API, saved 2026-10-26. Imports are general imports (customs value) and exports are total exports, in U.S. dollars. Duty collected is Census's calculated duty on imports for consumption. Figures cover every 10-digit product under the code, so they can include goods beyond this mineral, and the duty shown is not split into Section 232, Section 301 or antidumping duties. Bars show the largest code for each direction. Group rows such as the EU or OECD are left out so no country is counted twice.
Source: U.S. Census Bureau, International Trade API: U.S. imports and exports by HS code and country (calendar 2025, and January to Aug 2026) (data months 2025-12, 2026-08)
Value chain and risk
Where in the chain the bottlenecks sit, and what other governments and sources say about supply risk.
Value chain: where the bottlenecks are
Mining bottleneck
Congo (Kinshasa) mined an estimated 73% of the world's cobalt in 2025; a Michigan nickel-copper mine was the U.S. source of cobalt-bearing concentrate. (partly U.S.)
The source says
“Congo (Kinshasa) was the world’s leading source of mined cobalt and accounted for an estimated 73% of world total, followed by Indonesia, which accounted for 14%.”
“the Eagle Mine, a nickel-copper mine in Michigan, produced cobalt-bearing nickel concentrate”
Source: USGS Mineral Commodity Summaries 2026, Cobalt (2026-02)
Ore processing and primary recovery bottleneck
The cobalt-bearing concentrate from the Michigan mine is exported to Canada or overseas for processing. (no U.S. activity)
The source says
“which was exported to Canada or overseas for processing.”
Source: USGS Mineral Commodity Summaries 2026, Cobalt (2026-02)
Refining and separation bottleneck
China is the world's leading refined cobalt producer and its leading consumer, mainly for lithium-ion batteries. (U.S. role not stated)
The source says
“China remained the world leading producer of refined cobalt and the world leading consumer, primarily for the lithium-ion battery industry.”
Source: USGS Mineral Commodity Summaries 2026, Cobalt (2026-02)
The proclamation says that although the United States mines cobalt and nickel, it lacks the processing capacity to avoid downstream import reliance. (partly U.S.)
The source says
“even where the United States has domestic mining capacity, such as for cobalt, nickel, and rare earth elements, the United States lacks the domestic processing capacity to avoid downstream net-import reliance”
Source: White House proclamation, Adjusting Imports of Processed Critical Minerals and Their Derivative Products (Section 232) (2026-01-14)
EIA says Chinese companies held over two-thirds of world cobalt and lithium processing capacity in 2022. (U.S. role not stated)
The source says
“in 2022, Chinese companies accounted for over two-thirds of the world's cobalt and lithium processing capacity”
Source: EIA Today in Energy, China dominates global trade of battery minerals (2025-05-21)
The 2025 USGS edition says China led world refined-cobalt production and that most of its refinery output came from partially refined cobalt imported from Congo (Kinshasa) and Indonesia. (U.S. role not stated)
The source says
“China was the world's leading producer of refined cobalt and increased metal refining capacity throughout the year. The majority of China's refinery production was from partially refined cobalt imported from Congo (Kinshasa) and Indonesia.”
Source: USGS Mineral Commodity Summaries 2025, Cobalt (previous edition) (2025-01)
Metal, alloy and chemical
About five U.S. companies make cobalt chemicals; most U.S. supply is imports and scrap. (partly U.S.)
The source says
“About five companies in the United States produced cobalt chemicals.”
“Most U.S. cobalt supply consisted of imports and secondary (scrap) materials.”
Source: USGS Mineral Commodity Summaries 2026, Cobalt (2026-02)
Components and end use
Superalloys, mainly for aircraft gas turbine engines, took about 51% of U.S. cobalt in 2025, and cemented carbides 9%. (partly U.S.)
The source says
“An estimated 51% of cobalt consumed in the United States was used in superalloys, mainly for aircraft gas turbine engines”
“and 9% in cemented carbides for cutting and wear-resistant applications”
Source: USGS Mineral Commodity Summaries 2026, Cobalt (2026-02)
Recycling
Scrap supplied about 25% of estimated U.S. cobalt consumption in 2025. (partly U.S.)
The source says
“In 2025, cobalt content of purchased scrap represented 25% of estimated cobalt consumption.”
Source: USGS Mineral Commodity Summaries 2026, Cobalt (2026-02)
Pilot. Summaries are ours, from official pages; each quoted passage is checked against the saved page. “Bottleneck” (orange dot) is shown only where the quote shows one country dominating the stage or the United States relying on imports for it. “No sourced data yet” means we have not found a source, not that the stage is unproblematic.
Mines, plants and partners
Named facilities with their operators and locations, as each source describes them on the date shown. 9 sourced entries for Cobalt.
Mining
Kamoto Copper Company SA (Glencore 70%, Gecamines 25%, DRC State 5%)
Kolwezi, Lualaba Province, Democratic Republic of the Congo · Operating
The source says
“Kamoto Copper Company -- KCC -- is a copper and cobalt producer in the Democratic Republic of the Congo, jointly owned by Glencore (70%), Gécamines (25%) and the DRC State (5%).”
“Located in Kolwezi, in the province of Lualaba, our portfolio of assets includes: three open pit mines: KOV,T17 and Mashamba East one underground mine: KTO the Kamoto concentrator: KTC the Luilu refinery”
Source: Kamoto Copper Company, Who we are (2026)
Mutanda Mining SARL (Glencore partnership with the DRC government)
Kolwezi, Lualaba Province, Democratic Republic of the Congo · Operating
The source says
“Glencore operates two industrial assets producing copper and cobalt in the DRC: Kamoto Copper Company SA (KCC) – a partnership with the Gécamines – and Mutanda Mining SARL (MUMI) – a partnership with the DRC government– both located in Kolwezi, in the Lualaba Province.”
Source: Glencore in the DRC, Our operations (2026)
CMOC Group Limited
Democratic Republic of the Congo, Democratic Republic of the Congo · Operating
The source says
“CMOC holds an 80% stake in the TFM copper-cobalt mine and a 71.25% stake in the KFM copper-cobalt mine in the DRC.”
“As of 2025, TFM operates five production lines”
Source: CMOC Group Limited, The DRC - copper and cobalt (2025)
Jervois (Jervois Mining USA)
near Salmon, Idaho, United States · Idle
The source says
“Jervois acquired the partially complete Idaho Cobalt Operations (“ICO”) near Salmon, Idaho in 2019. Having finalised construction of ICO, Jervois has currently suspended ICO.”
“ICO is the only primary cobalt mine in the United States”
Source: Jervois Global, Idaho Cobalt Operations (2026)
Vale Base Metals
Voisey’s Bay, Newfoundland and Labrador, Canada · Operating
The source says
“Voisey’s Bay entered production in 2005 as an open pit operation mining nickel, copper, and cobalt.”
“The operation also includes a concentrator that produces nickel-copper-cobalt and copper-concentrates.”
“We operate the world-class Voisey’s Bay nickel deposit and the Long Harbour Processing Plant”
Source: Vale Base Metals, Voisey’s Bay (2026)
Refining and separation
Electra Battery Materials
Ontario, Canada · Planned
The source says
“Electra’s hydrometallurgical facility is the only facility of its kind in North America. It will supply the electric vehicle market with cobalt sulfate”
“Located in Ontario, Canada”
Source: Electra Battery Materials, Ontario Refinery (2026)
Freeport Cobalt (Umicore agreed in 2019 to acquire the refining and cathode precursor activities)
Kokkola, Finland · Status not stated
The source says
“Umicore announced today that it has reached an agreement to acquire Freeport Cobalt’s cobalt refining and cathode precursor activities in Kokkola, Finland”
“The state-of-the-art Kokkola refinery is Europe’s largest cobalt refinery.”
Source: Umicore, Umicore to acquire cobalt refinery and cathode precursor operations in Finland (2019)
Vale Base Metals
Long Harbour, Newfoundland and Labrador, Canada · Operating
The source says
“Newfoundland and Labrador Our integrated mining, milling, and processing operations in Newfoundland and Labrador help provide mineral security to a world in transition.”
“Nickel concentrate from Voisey’s Bay is shipped to the Long Harbour Processing Plant where it is refined into nickel, cobalt and copper metal.”
“We operate the world-class Voisey’s Bay nickel deposit and the Long Harbour Processing Plant”
Source: Vale Base Metals, Long Harbour (2026)
Vale Base Metals
Sudbury, Canada · Operating
The source says
“In Sudbury, we have one open-pit mine and operate five underground mines in addition to a mill, smelter, and refinery.”
“Canada Long Harbour Port Colborne Sudbury Complex Thompson Voisey’s Bay”
“The nickel matte is delivered to the Copper Cliff Nickel Refinery for final processing.”
Source: Vale Base Metals, Sudbury Complex (2026)
A curated list, not a complete register: it shows facilities we could confirm in a source page, and a missing name means we have not sourced it, not that it does not exist. Each quoted passage is checked against the saved page. Partnerships are listed only where the source states them.
Geopolitics and supply risk
Export controls by other countries
Congo (Kinshasa) banned cobalt exports in February 2025, then replaced the ban in October with annual export quotas (96,600 tons a year in 2026 and 2027).
The source says
“In February, Congo (Kinshasa) temporarily banned cobalt exports to address market oversupply and low prices.”
“In October, the temporary ban was replaced with export quotas of 18,125 tons of contained cobalt for the remainder of 2025, and up to 96,600 tons contained cobalt per year in 2026 and 2027, inclusive of 9,600 tons for national strategic reserves.”
Source: USGS Mineral Commodity Summaries 2026, Cobalt (2026-02)
Who supplies it
Congo (Kinshasa) supplied an estimated 73% of mined cobalt in 2025, and China was the leading refiner.
The source says
“Congo (Kinshasa) was the world's leading source of mined cobalt and accounted for an estimated 73% of world total, followed by Indonesia, which accounted for 14%.”
“China remained the world leading producer of refined cobalt”
Source: USGS Mineral Commodity Summaries 2026, Cobalt (2026-02)
U.S. policy and funding
In 2025 the United States asked for bids to buy 7,480 tons of cobalt for the National Defense Stockpile over five years, then cancelled the solicitation before year end.
The source says
“In 2025, the United States published a solicitation to procure 7,480 tons of cobalt over a period of 5 years for the National Defense Stockpile.”
“The solicitation was cancelled before the end of the year.”
Source: USGS Mineral Commodity Summaries 2026, Cobalt (2026-02)
Summaries are ours, from official pages. Each quoted passage is checked against the saved source page. This is a curated list for the edition shown, not a complete or current record of every measure.
Policy and funding
Federal items we track for this mineral, each linked to its original.
Policy timeline
Tagged by AI from federal sources; each links to the original. How we label.
Source: U.S. federal sources (Federal Register, Grants.gov, DOE, Regulations.gov, DFC), Policy items tagged for Cobalt (dates per item)
Federal awards already made
Glencore Ltd. · Department of Defense · $240.3M obligated · started 2026-06-29
Source: usaspending.gov, retrieved 2026-10-29
Glencore Ltd. · Department of Defense · $210.3M obligated · started 2026-05-15
Source: usaspending.gov, retrieved 2026-10-29
American Battery Technology Company · Department of Energy · $147.6M obligated · started 2025-01-01
Source: usaspending.gov, retrieved 2026-10-29
Electra Battery Materials Corporation · Department of Defense · $20M obligated · started 2024-08-19
Source: usaspending.gov, retrieved 2026-10-29
Cirba Solutions, LLC · Department of Energy · $7.4M obligated · started 2023-10-01
Source: usaspending.gov, retrieved 2026-10-29
The 5 largest of 20 AI-tagged awards from USAspending (last 12 months, found by keyword; some are only loosely about this mineral). See all awards for Cobalt.
Source: U.S. Department of the Treasury, Bureau of the Fiscal Service, USAspending.gov: spending by award (contracts and grants, last 12 months) (award start dates per item)
Data tables
The USGS figures behind the charts. Click a column heading to sort.
Cobalt: USGS tables
United States
| Measure | Unit | 2024 | 2025 |
|---|---|---|---|
| Net import reliance as a percentage of apparent consumption | percent | 74 | 79 |
| Production: Mine | metric tons | 200 | 300 |
| Production: Secondary | metric tons | 2,050 | 2,000 |
| Imports for consumption | metric tons | 10,800 | 14,000 |
| Exports | metric tons | 4,880 | 4,500 |
| Consumption (includes secondary): Estimated | metric tons | 7,830 | 8,000 |
| Consumption (includes secondary): Apparent | metric tons | 7,960 | 9,600 |
| Price, average, dollars per pound: U.S. spot, cathode | dollars per pound | 16.77 | 21 |
| Price, average, dollars per pound: London Metal Exchange (LME), cash | dollars per pound | 11.84 | 15 |
| Stocks, yearend: Industry | metric tons | 956 | 1,500 |
| Stocks, yearend: LME, U.S. warehouse | metric tons | 34 | 34 |
World production (metric tons; top 6 of 12, plus other countries)
| Country | 2024 | 2025 | Share |
|---|---|---|---|
| Congo (Kinshasa) | 226,000 | 230,000 | 74% |
| Indonesia | 35,000 | 44,000 | 14% |
| Russia | 8,000 | 7,700 | 2% |
| Madagascar | 3,100 | 3,900 | 1% |
| Australia | 4,780 | 3,700 | 1% |
| Philippines | 3,100 | 3,700 | 1% |
| Other countries | 7,780 | 9,100 | 3% |
World total 2025: 310,000 metric tons (as printed by USGS, rounded).
World reserves (metric tons; top 6 of 12, plus other countries)
| Country | 2025 | Share |
|---|---|---|
| Congo (Kinshasa) | 6,000,000 | 50% |
| Australia | 1,700,000 | 14% |
| Russia | 800,000 | 7% |
| Indonesia | 760,000 | 6% |
| Cuba | 500,000 | 4% |
| Philippines | 260,000 | 2% |
| Other countries | 780,000 | 6% |
World total 2025: 12,000,000 metric tons (as printed by USGS, rounded).
U.S. import sources: Metal, oxide, and salts (percent of imports, 2021–24)
| Country | Share (%) |
|---|---|
| Norway | 26 |
| Finland | 16 |
| Canada | 14 |
| Japan | 14 |
| Other countries | 30 |
Source: U.S. Geological Survey, Mineral Commodity Summaries 2026: Cobalt (February 2026)