All fact sheets · The Strata Memo
Aluminum
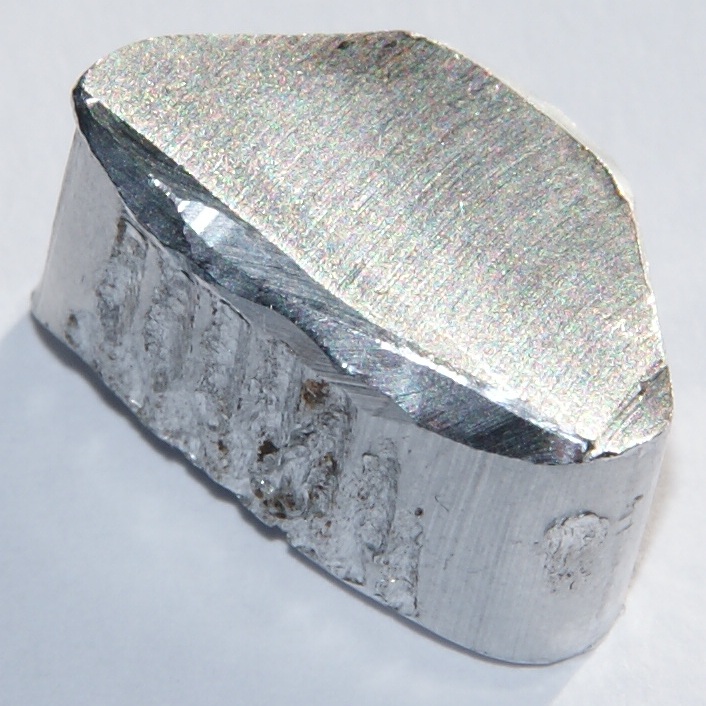

Hover, focus or tap to see the real thing
Photo Unknown author Unknown author. “Aluminium-4.jpg.” CC BY 3.0. Wikimedia Commons. File page
Chemical details
- State at room conditions
- Solid
- Melting point
- 933 K (660 °C)
- Boiling point
- 2,792 K (2,519 °C)
- Density
- 2.70 g/cm³
- Common oxidation states
- +3
- Electronegativity (Pauling)
- 1.61
- Atomic radius
- 184 pm
- First ionization energy
- 5.986 eV
- Discovered
- Ancient
Source: U.S. National Library of Medicine, PubChem, Periodic Table of Elements (element Aluminum) (current at retrieval)
On the USGS 2025 List of Critical Minerals. Figures: USGS Mineral Commodity Summaries 2026 (data release, public domain). Estimates are USGS's; check the USGS chapter for notes. Each panel names its source; full citations are in the methodology source register.
Overview
The headline numbers: how much the U.S. depends on imports and how concentrated supply is.
How much does the U.S. import?
of U.S. aluminum use was met by imports in 2025 (USGS net import reliance).
Source: U.S. Geological Survey, Mineral Commodity Summaries 2026: Aluminum (February 2026)
Did you know?
Aluminum protects itself with a thin layer of oxide on its surface that shields the metal from attack by air.
Checked against two independent sources. Verified 2026-10-26.
Sources: Wikipedia · WebElements (Wikipedia text is CC BY-SA)
How concentrated is supply?
72% of world production comes from three countries (China, India, Russia). Highly concentrated.
Thirds of the bar: under 33%, 33 to 65%, 66% and over. Our own rule of thumb, not a USGS rating.
Source: U.S. Geological Survey, Mineral Commodity Summaries 2026: Aluminum (February 2026)
Supply
Who produces it, where the reserves are, where U.S. imports come from, and how U.S. supply has moved.
Who has it, and who digs it?
Where it is produced, 2025 (Smelter production)
| Name | Value |
|---|---|
| China | 61% |
| India | 6% |
| Russia | 5% |
| Canada | 4% |
| United Arab Emirates | 4% |
| Bahrain | 2% |
Share of the world total as printed by USGS (rounded). Production and reserves are different things: reserves are what is economic to mine. Hover or focus a bar for its value, or switch to the table view.
Source: U.S. Geological Survey, Mineral Commodity Summaries 2026: Aluminum (February 2026)
Where U.S. imports come from
Choose a data set, then a view. A country keeps the same color in every chart on this page. Grey means other countries, or a country beyond the seven colors (always labeled). Hover or focus a mark for its value, or use the table view.
- Canada56%
- United Arab Emirates8%
- Bahrain4%
- China3%
- Other countries29%
| Country | Share of U.S. imports | Share of this chart |
|---|---|---|
| Canada | 56% | 56.0% |
| United Arab Emirates | 8% | 8.0% |
| Bahrain | 4% | 4.0% |
| China | 3% | 3.0% |
| Other countries | 29% | 29.0% |
Average share of U.S. imports of all forms, 2021–24, as printed by USGS (rounded, so shares may not sum to 100). Other countries are USGS's own grouping.
Source: U.S. Geological Survey, Mineral Commodity Summaries 2026: Aluminum (February 2026)
- Guyana36% · $50.2M
- Jamaica29% · $40.1M
- Turkey14% · $19.1M
- China12% · $16.5M
- Australia5% · $7.2M
- Brazil3% · $3.8M
- All other countries1% · $727K
| Country | U.S. imports, 2025 | Share of this chart |
|---|---|---|
| Guyana | 36% · $50.2M | 36.5% |
| Jamaica | 29% · $40.1M | 29.2% |
| Turkey | 14% · $19.1M | 13.9% |
| China | 12% · $16.5M | 12.0% |
| Australia | 5% · $7.2M | 5.2% |
| Brazil | 3% · $3.8M | 2.8% |
| All other countries | 1% · $727K | 0.5% |
U.S. general imports (customs value) in calendar 2025 under HS 2606; countries beyond the top six are grouped. The code can include goods beyond this mineral. The Shift view compares each country's share of 2025 with its share of Jan to Aug 2026 (shares of each period's total).
Source: U.S. Census Bureau, International Trade API: U.S. imports by HS code and country (calendar 2025; Jan to Aug 2026) (data months 2025-12, 2026-08)
- Brazil50% · $617.9M
- China11% · $135.0M
- Germany11% · $131.2M
- Jamaica8% · $98.9M
- Canada7% · $84.7M
- France3% · $38.7M
- All other countries11% · $140.6M
| Country | U.S. imports, 2025 | Share of this chart |
|---|---|---|
| Brazil | 50% · $617.9M | 49.5% |
| China | 11% · $135.0M | 10.8% |
| Germany | 11% · $131.2M | 10.5% |
| Jamaica | 8% · $98.9M | 7.9% |
| Canada | 7% · $84.7M | 6.8% |
| France | 3% · $38.7M | 3.1% |
| All other countries | 11% · $140.6M | 11.3% |
U.S. general imports (customs value) in calendar 2025 under HS 2818; countries beyond the top six are grouped. The code can include goods beyond this mineral. The Shift view compares each country's share of 2025 with its share of Jan to Aug 2026 (shares of each period's total).
Source: U.S. Census Bureau, International Trade API: U.S. imports by HS code and country (calendar 2025; Jan to Aug 2026) (data months 2025-12, 2026-08)
- Canada62% · $6.0B
- United Arab Emirates15% · $1.5B
- South Africa5% · $461.4M
- Bahrain4% · $434.7M
- Argentina4% · $414.2M
- India4% · $374.7M
- All other countries6% · $540.9M
| Country | U.S. imports, 2025 | Share of this chart |
|---|---|---|
| Canada | 62% · $6.0B | 61.6% |
| United Arab Emirates | 15% · $1.5B | 15.4% |
| South Africa | 5% · $461.4M | 4.8% |
| Bahrain | 4% · $434.7M | 4.5% |
| Argentina | 4% · $414.2M | 4.3% |
| India | 4% · $374.7M | 3.9% |
| All other countries | 6% · $540.9M | 5.6% |
U.S. general imports (customs value) in calendar 2025 under HS 7601; countries beyond the top six are grouped. The code can include goods beyond this mineral. The Shift view compares each country's share of 2025 with its share of Jan to Aug 2026 (shares of each period's total).
Source: U.S. Census Bureau, International Trade API: U.S. imports by HS code and country (calendar 2025; Jan to Aug 2026) (data months 2025-12, 2026-08)
U.S. supply mix
thousand metric tons, 2021 to 2025
Imports are before exports, so the stack is not the same as U.S. consumption.
Source: U.S. Geological Survey, Mineral Commodity Summaries 2026: Aluminum (February 2026)
Price
Price, ingot, average U.S. market (spot), cents per pound
Source: U.S. Geological Survey, Mineral Commodity Summaries 2026: Aluminum (February 2026)
Trade and tariffs
Tariff codes and the countries behind U.S. imports and exports.
Trade codes and tariffs
| HTS code | What it covers | Normal rate | Column 2 rate |
|---|---|---|---|
| 2606 | Aluminum ores and concentrates | Free | $1/t |
| 2818 | Artificial corundum, whether or not chemically defined; aluminum oxide; aluminum hydroxide | Free to 1.3% * | varies, 1.1¢/kg; 4.1%; Free |
| 7601 | Unwrought aluminum | Free to 2.6% * | 10.5% to 25% |
Rates from the U.S. Harmonized Tariff Schedule (USITC, saved 2026-10-26). The normal rate is column 1 general; column 2 applies to countries without normal trade relations. A range means different products under the code have different rates. An asterisk means the schedule footnotes point to Chapter 99 additional-duty headings. Section 232, Section 301, emergency tariffs and antidumping or countervailing duties are set in separate notices and are not shown. Look up any code at hts.usitc.gov. These are the main codes for this mineral, not a complete list.
Source: U.S. International Trade Commission, Harmonized Tariff Schedule of the United States, general and column 2 rates (edition current when saved)
U.S. trade by country
U.S. imports in 2025 by source country, code 7601
| Name | Value |
|---|---|
| Canada | 62% · $6.0B |
| United Arab Emirates | 15% · $1.5B |
| South Africa | 5% · $461.4M |
| Bahrain | 4% · $434.7M |
| Argentina | 4% · $414.2M |
| India | 4% · $374.7M |
U.S. exports in 2025 by destination, code 7601
| Name | Value |
|---|---|
| Mexico | 58% · $680.3M |
| Canada | 25% · $295.8M |
| Colombia | 5% · $55.6M |
| Malaysia | 4% · $43.4M |
| France | 3% · $37.0M |
| United Kingdom | 1% · $8.6M |
2606 Aluminum ores and concentrates
Top import sources Guyana 36%, Jamaica 29%, Turkey 14%
Top export destinations India 29%, Malaysia 28%, Mexico 20%
2818 Artfl corundum w/nt chem defnd alum oxid/hydroxide
Top import sources Brazil 50%, China 11%, Germany 11%
Top export destinations China 20%, Mexico 15%, Canada 10%
7601 Aluminum, unwrought
Top import sources Canada 62%, United Arab Emirates 15%, South Africa 5%
Top export destinations Mexico 58%, Canada 25%, Colombia 5%
U.S. Census Bureau International Trade API, saved 2026-10-26. Imports are general imports (customs value) and exports are total exports, in U.S. dollars. Duty collected is Census's calculated duty on imports for consumption. Figures cover every 10-digit product under the code, so they can include goods beyond this mineral, and the duty shown is not split into Section 232, Section 301 or antidumping duties. Bars show the largest code for each direction. Group rows such as the EU or OECD are left out so no country is counted twice.
Source: U.S. Census Bureau, International Trade API: U.S. imports and exports by HS code and country (calendar 2025, and January to Aug 2026) (data months 2025-12, 2026-08)
Value chain and risk
Where in the chain the bottlenecks sit, and what other governments and sources say about supply risk.
Value chain: where the bottlenecks are
Mining bottleneck
U.S. bauxite output is limited to nonmetallurgical use, net import reliance is above 75%, and Jamaica supplied 60% of bauxite imports in 2021-24. (no U.S. activity)
The source says
“In 2025, a limited amount of bauxite and bauxitic clay was produced for nonmetallurgical use in Alabama, Arkansas, and Georgia.”
“Net import reliance4 as a percentage of apparent consumption >75 >75 >75 >75 >75”
“Import Sources (2021–24): Bauxite:2 Jamaica, 60%; Turkey, 16%; Guyana, 9%; Australia, 8%; and other, 7%.”
Source: USGS, Mineral Commodity Summaries 2026: Bauxite and Alumina (2026)
Ore processing and primary recovery
In 2025 one U.S. alumina refinery (Gramercy, Louisiana) ran on imported bauxite, while a second (Burnside, Louisiana) stayed idle. (partly U.S.)
The source says
“In 2025, one domestic alumina refinery produced alumina from imported bauxite.”
“A 1.2-million-ton-per-year alumina refinery in Gramercy, LA, produced alumina for aluminum smelting and specialty-grade alumina.”
“A 500,000-ton-per-year alumina refinery in Burnside, LA, was temporarily shut down in August 2020 and remained idle in 2025.”
Source: USGS, Mineral Commodity Summaries 2026: Bauxite and Alumina (2026)
Refining and separation
Three companies ran six primary aluminum smelters in five States in 2025, but two smelters (Hawesville, KY, and New Madrid, MO) have been shut down since 2022 and 2024. (partly U.S.)
The source says
“In 2025, three companies operated six primary aluminum smelters in five States.”
“Two smelters located in Hawesville, KY, and New Madrid, MO, have been temporarily shut down since 2022 and 2024, respectively.”
Source: USGS Mineral Commodity Summaries 2026, Aluminum (PDF page 44) (2026-02)
Restarts were announced in 2025: more than 50,000 tons a year of idle capacity at a South Carolina smelter. (partly U.S.)
The source says
“In August, plans were announced to restart more than 50,000 tons per year of idled capacity at a 229,000-ton-per-year primary aluminum smelter in South Carolina, with full production planned for mid-2026.”
Source: USGS Mineral Commodity Summaries 2026, Aluminum (PDF page 44) (2026-02)
Metal, alloy and chemical
U.S. imports of unwrought aluminum came mainly from Canada (56%), the United Arab Emirates (8%) and Bahrain (4%) in 2021-24. (partly U.S.)
The source says
“Import Sources (2021–24): Canada, 56%; United Arab Emirates, 8%; Bahrain, 4%;”
Source: USGS Mineral Commodity Summaries 2026, Aluminum (PDF page 44) (2026-02)
Components and end use
Transportation took 36% of U.S. aluminum use in 2025, then packaging (24%) and building (13%). (U.S. role not stated)
The source says
“Transportation applications accounted for 36% of domestic consumption; the remainder was used in packaging, 24%; building, 13%;”
Source: USGS Mineral Commodity Summaries 2026, Aluminum (PDF page 44) (2026-02)
Recycling
Aluminum recovered from old scrap equalled about 28% of U.S. apparent consumption in 2025. (U.S. activity)
The source says
“Aluminum recovered from old scrap was equivalent to about 28% of apparent consumption.”
Source: USGS Mineral Commodity Summaries 2026, Aluminum (PDF page 44) (2026-02)
Pilot. Summaries are ours, from official pages; each quoted passage is checked against the saved page. “Bottleneck” (orange dot) is shown only where the quote shows one country dominating the stage or the United States relying on imports for it. “No sourced data yet” means we have not found a source, not that the stage is unproblematic.
Mines, plants and partners
Named facilities with their operators and locations, as each source describes them on the date shown. 11 sourced entries for Aluminum.
Mining
Alcoa Corporation
Pinjarra, Western Australia, Australia · Status not stated
The source says
“Huntly Mine Off Del Park Road PO Box 172 Pinjarra, Western Australia, 6208 +61 (0)8 9530 2800 Facility Production: Bauxite”
Source: Alcoa Corporation, Locations (2026)
Alcoa Corporation
Juruti, Pará, Brazil · Status not stated
The source says
“Juruti Enseada do Lago Grande Juruti - Rodovia PA 257, km 0,5. S/N. Juruti (PA), Brasil CEP 68170-000 Facility Production: Bauxite”
Source: Alcoa Corporation, Locations (2026)
Ore processing and primary recovery
Emirates Global Aluminium (EGA)
Next to the Al Taweelah smelter, Abu Dhabi, United Arab Emirates · Operating
The source says
“Al Taweelah alumina refinery was the first in the United Arab Emirates and only the second in the Middle East. It began production in 2019.”
“The plant converts bauxite into alumina, the feedstock for aluminium smelters.”
“Al Taweelah alumina refinery is located next to our Al Taweelah smelter.”
Source: Emirates Global Aluminium, Al Taweelah alumina refinery (2026)
Alcoa Corporation
Pinjarra, Western Australia, Australia · Status not stated
The source says
“Pinjarra Refinery South West Highway PO Box 172 Pinjarra, Western Australia, 6208 +61 (0)8 9531 6611 / 6494 Facility Production: Alumina”
Source: Alcoa Corporation, Locations (2026)
Alcoa Corporation
São Luís, Maranhão, Brazil · Status not stated
The source says
“São Luís Av. Engenheiro Emiliano Macieira, KM 18, s/n – Pedrinhas São Luís (MA), Brasil CEP 65095-604 (98) 3301 1155 Facility Production: Alumina, Aluminum Smelting”
Source: Alcoa Corporation, Locations (2026)
Refining and separation
Alcoa Corporation
Newburgh, Indiana, United States · Status not stated
The source says
“Alcoa Warrick 4400 West State Route 66 Newburgh, IN 47630 (Receiving: Building 47C, Bulk materials: Building 49) 812-853-6111 Facility Production: Aluminum Smelting and Energy”
Source: Alcoa Corporation, Locations (2026)
Alcoa Corporation
Massena, New York, United States · Status not stated
The source says
“Massena Operations 1814 State Highway 131 Massena, NY 13662 (Shipments received at 45 Country Route 42) 1-315-705-2424 Facility Production: Aluminum Smelting and Casting”
Source: Alcoa Corporation, Locations (2026)
Alcoa Corporation
Ferndale, Washington, United States · Idle
The source says
“Intalco Works 4050 Mountain View Road Ferndale, Wash. 98248 (360) 384-7061 Facility Production: Fully Curtailed Aluminum Smelting and Casting Capacity”
Source: Alcoa Corporation, Locations (2026)
Century Aluminum Company
Mt. Holly, South Carolina, United States · Operating
The source says
“Century Aluminum Company (NASDAQ: CENX) announced today that production of the first hot metal has begun following the expansion project at its Mt. Holly, S.C. plant.”
“Century Aluminum owns and operates primary aluminum smelting facilities in the United States and Iceland”
“The expansion project increases Century’s leading position as the largest producer of primary aluminum in the United States.”
Source: Century Aluminum, Century Aluminum Commences Expanded Production at Mt. Holly Smelter (press release) (2026-04-16)
Emirates Global Aluminium (EGA)
Khalifa Industrial Zone Abu Dhabi (KIZAD), Al Taweelah, United Arab Emirates · Status not stated
The source says
“Emirates Global Aluminium’s Al Taweelah site is located in Khalifa Industrial Zone Abu Dhabi (KIZAD), approximately halfway between the cities of Abu Dhabi and Dubai.”
“Our smelter at Al Taweelah was built in two phases.”
“Al Taweelah was the largest single-site smelter in the world when completed.”
Source: Emirates Global Aluminium, Al Taweelah (2026)
Emirates Global Aluminium (EGA)
Near Jebel Ali Port, south of Dubai, United Arab Emirates · Operating
The source says
“Emirates Global Aluminium's smelter at Jebel Ali was the first to be built in the United Arab Emirates and only the second in the Gulf.”
“Our site is located near Jebel Ali Port, south of the historic centre of Dubai, and covers an area five times bigger than Dubai Mall.”
“We have seven potlines at Jebel Ali smelter.”
Source: Emirates Global Aluminium, Jebel Ali (2026)
A curated list, not a complete register: it shows facilities we could confirm in a source page, and a missing name means we have not sourced it, not that it does not exist. Each quoted passage is checked against the saved page. Partnerships are listed only where the source states them.
Policy and funding
Federal items we track for this mineral, each linked to its original.
Policy timeline
Tagged by AI from federal sources; each links to the original. How we label.
Source: U.S. federal sources (Federal Register, Grants.gov, DOE, Regulations.gov, DFC), Policy items tagged for Aluminum (dates per item)
Federal awards already made
University of Illinois · Department of Energy · $4M obligated · started 2024-08-01
Source: usaspending.gov, retrieved 2026-10-29
Massachusetts Institute of Technology · National Science Foundation · $3M obligated · started 2026-09-01
Source: usaspending.gov, retrieved 2026-10-29
The Pennsylvania State University · Department of Energy · $2.1M obligated · started 2024-03-01
Source: usaspending.gov, retrieved 2026-10-29
Big Metal Additive LLC · Department of Defense · $1.1M obligated · started 2026-04-10
Source: usaspending.gov, retrieved 2026-10-29
Loukus Technologies, Inc. · Department of Energy · $1M obligated · started 2026-10-01
Source: usaspending.gov, retrieved 2026-10-29
The 5 largest of 6 AI-tagged awards from USAspending (last 12 months, found by keyword; some are only loosely about this mineral). See all awards for Aluminum.
Source: U.S. Department of the Treasury, Bureau of the Fiscal Service, USAspending.gov: spending by award (contracts and grants, last 12 months) (award start dates per item)
Data tables
The USGS figures behind the charts. Click a column heading to sort.
Aluminum: USGS tables
United States
| Measure | Unit | 2024 | 2025 |
|---|---|---|---|
| Net import reliance as a percentage of apparent consumption | percent | 62 | 60 |
| Production: Primary | thousand metric tons | 676 | 660 |
| Production: Secondary (from old scrap) | thousand metric tons | 1,560 | 1,600 |
| Production: Secondary (from new scrap) | thousand metric tons | 2,120 | 2,000 |
| Imports for consumption: Crude and semi-fabricated products | thousand metric tons | 4,840 | 4,400 |
| Imports for consumption: Scrap | thousand metric tons | 700 | 890 |
| Exports: Crude and semi-fabricated products | thousand metric tons | 1,360 | 890 |
| Exports: Scrap | thousand metric tons | 2,100 | 2,200 |
| Consumption, apparent | thousand metric tons | 5,830 | 5,700 |
| Supply, apparent | thousand metric tons | 7,950 | 7,700 |
| Price, ingot, average U.S. market (spot), cents per pound | cents per pound | 129.5 | 180 |
| Stocks, yearend: Aluminum industry | thousand metric tons | 1,690 | 1,800 |
| Stocks, yearend: London Metal Exchange (LME), U.S. warehouses | thousand metric tons | 16 | 8 |
| Employment, number | number | 29,900 | 30,000 |
World production: Smelter production (thousand metric tons; top 6 of 12, plus other countries)
| Country | 2024 | 2025 | Share |
|---|---|---|---|
| China | 44,000 | 45,000 | 61% |
| India | 4,200 | 4,200 | 6% |
| Russia | 3,880 | 3,900 | 5% |
| Canada | 3,320 | 3,300 | 4% |
| United Arab Emirates | 2,690 | 2,700 | 4% |
| Bahrain | 1,620 | 1,600 | 2% |
| Other countries | 6,680 | 7,000 | 9% |
World total 2025: 74,000 thousand metric tons (as printed by USGS, rounded).
U.S. import sources: All (percent of imports, 2021–24)
| Country | Share (%) |
|---|---|
| Canada | 56 |
| United Arab Emirates | 8 |
| Bahrain | 4 |
| China | 3 |
| Other countries | 29 |
Source: U.S. Geological Survey, Mineral Commodity Summaries 2026: Aluminum (February 2026)